
Fig. 5.
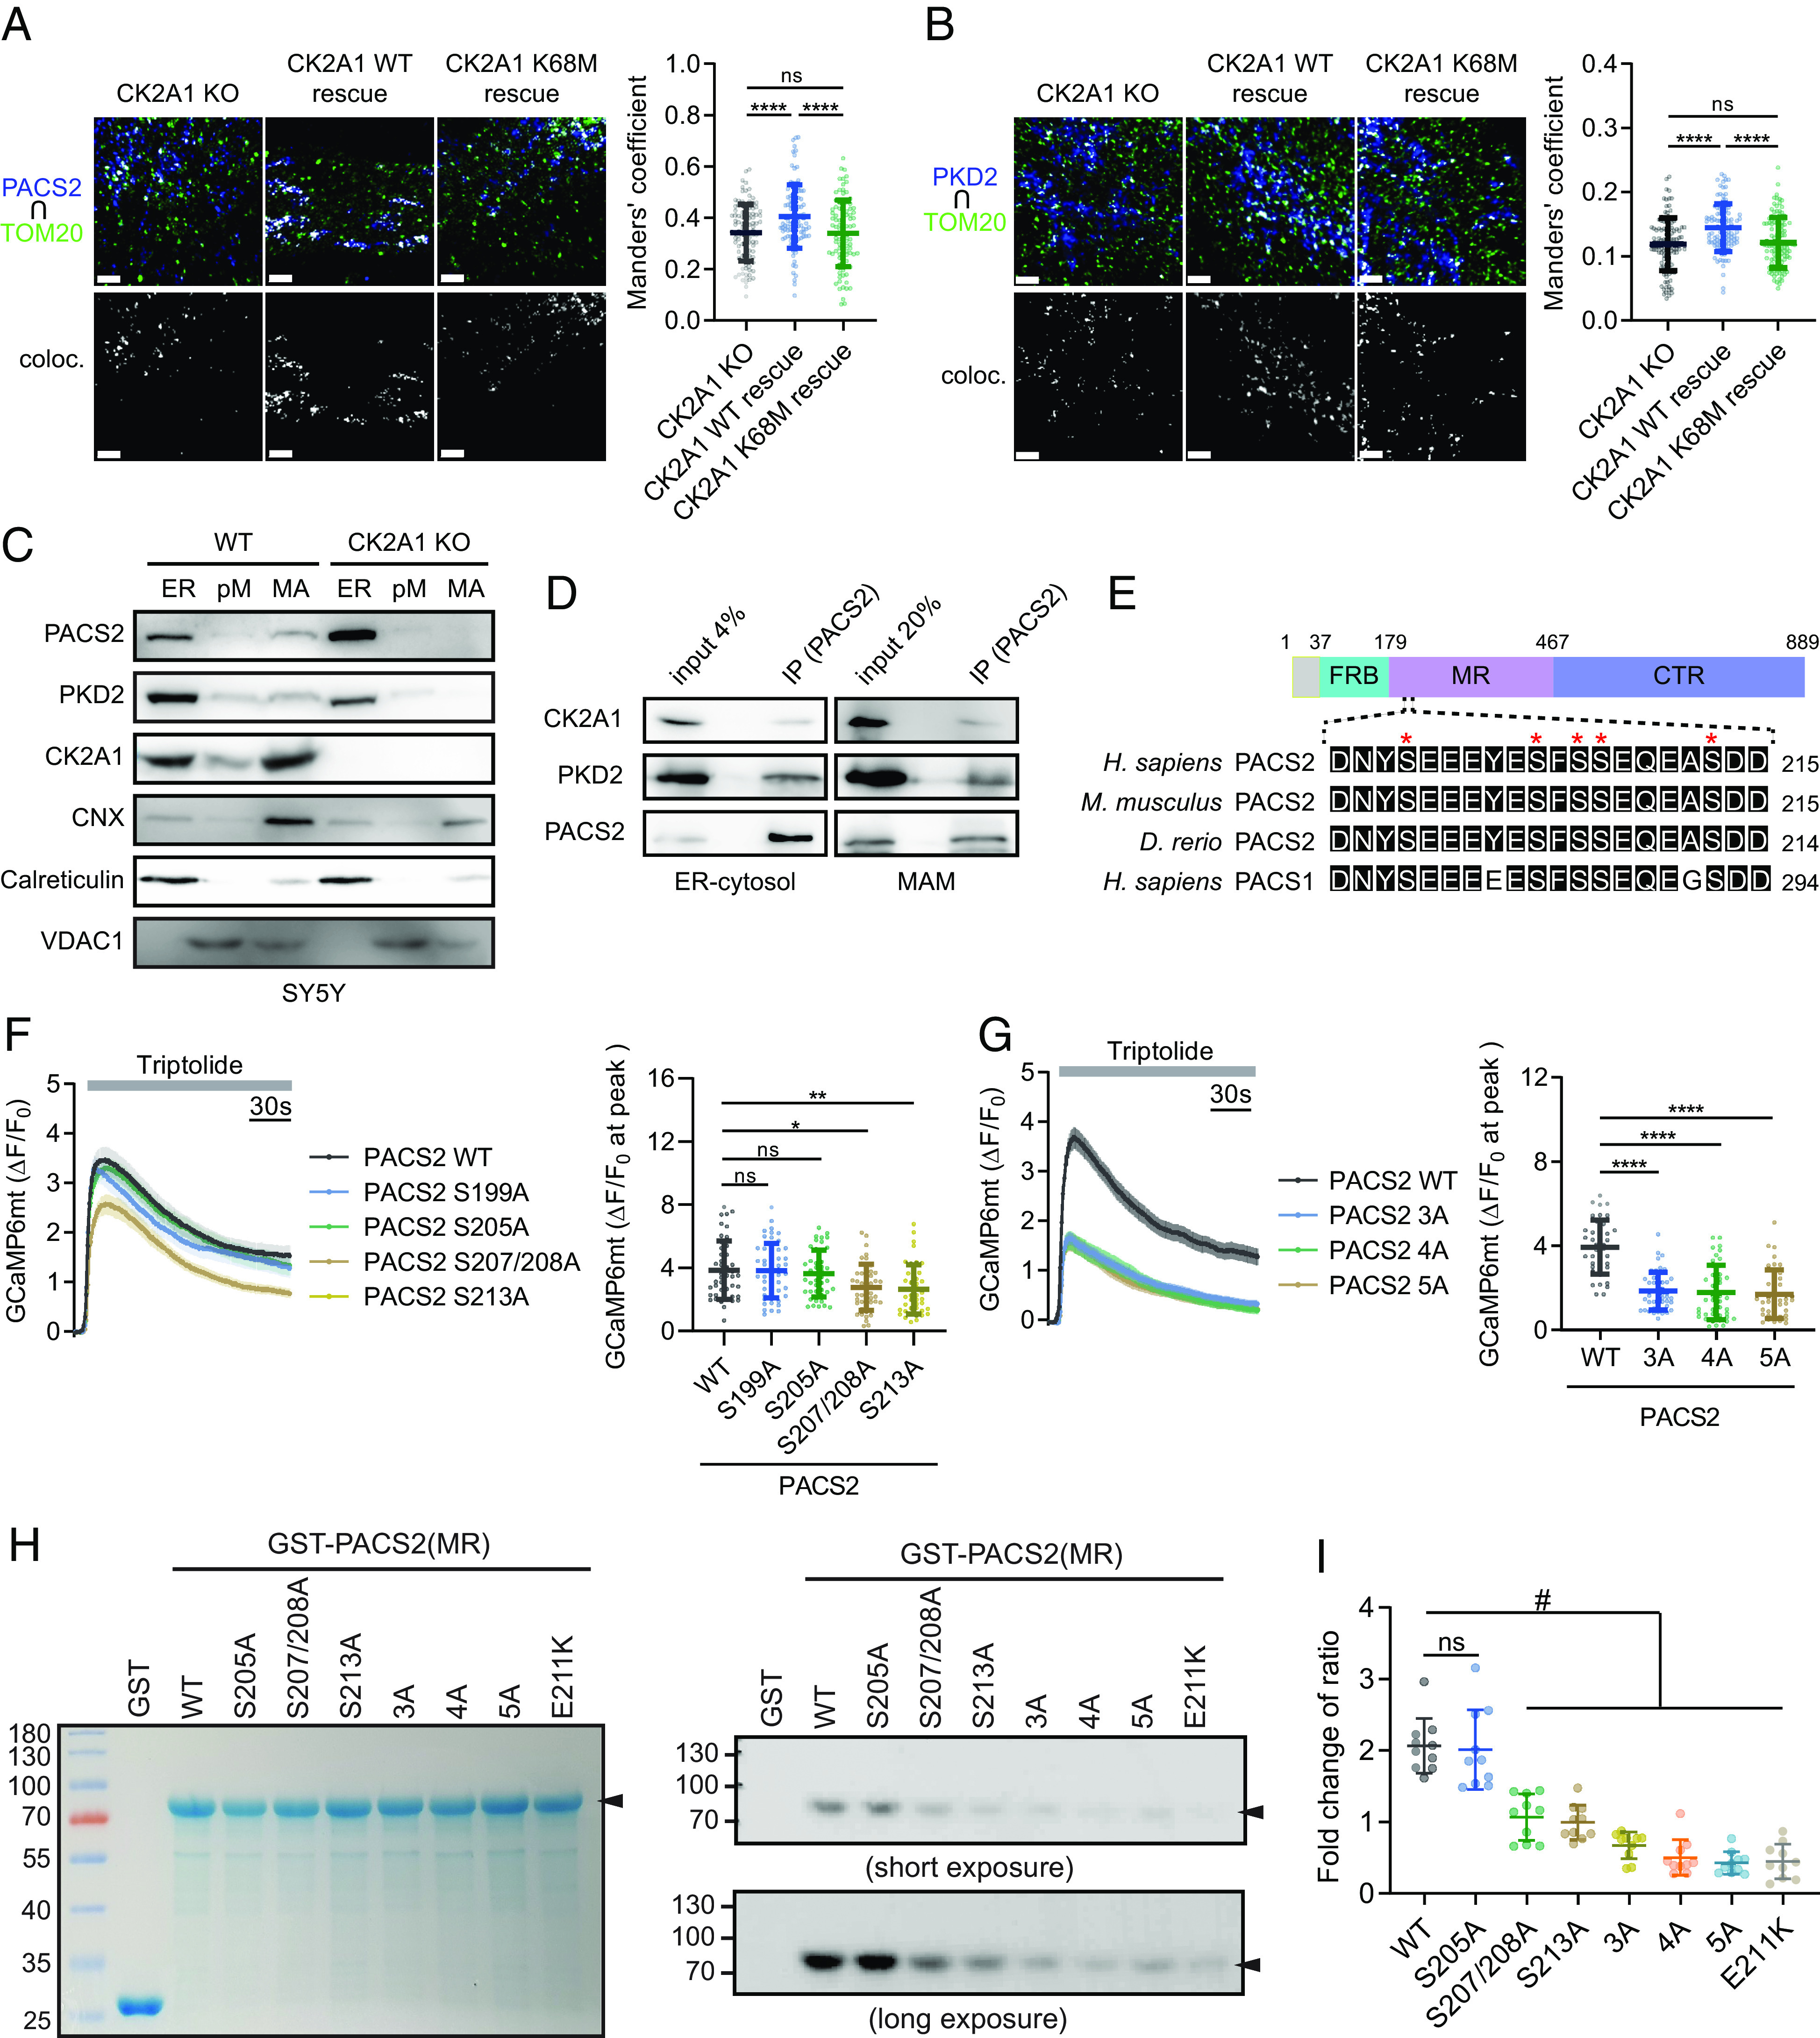
Phosphorylation of PACS2 by CK2A1 regulates the formation and Ca2+ homeostasis of the CK2A1–PACS2–PKD2 complex at MAMs. (A) Representative images of colocalization of endogenous PACS2 with TOM20 in CK2A1 KO SY5Y cells rescued by CK2A1 WT and K68M. The Right panel shows Manders’ coefficient of PACS2 overlapping mitochondria. Scale bars, 2 µm. Total cell number of each group: CK2A1 KO = 103, CK2A1 WT rescue = 102, CK2A1 K68M rescue = 96. (B) Representative images of colocalization of endogenous PKD2 with TOM20 in CK2A1 KO SY5Y cells rescued by CK2A1 WT and K68M. The Right panel shows Manders’ coefficient of PKD2 overlapping mitochondria. Scale bars, 2 µm. Total cell number of each group: CK2A1 KO = 113, CK2A1 WT rescue = 100, CK2A1 K68M rescue = 110. (C) Subcellular fractionation of SY5Y WT and CK2A1 KO cells followed by western blotting. ER markers: calnexin (CNX) and calreticulin; mitochondrial marker: VDAC1; pM: pure mitochondria; MA: MAM fraction. (D) Western blotting of coimmunoprecipitates using antibodies against PACS2 to detect endogenous CK2A1 and PKD2 in isolated ER-cytosol and MAM fractions. (E) Highly conserved acidic cluster region among species with the paralogue protein PACS1 located in the middle region of the PACS2 protein. FBR: furin (cargo)-binding region, MR: middle region; CTR: C-terminal region. Red asterisks indicate serine residues (S199-213) possibly phosphorylated by CK2A1. (F) Mitochondrial Ca2+ influx stimulated by triptolide was recorded in the somatic region of primary neurons expressing various phospho-dead mutations of PACS2 (S199A, S205A, S207/208A, and S213A). Total cells analyzed: PACS2 WT = 44, PACS2 S199A = 49, PACS2 S205A = 45, PACS2 S207/208A = 45, PACS2 S213A = 43. (G) Different combinations of phospho-dead mutations of PACS2 3A (S207/208/213A), 4A (S205/207/208/213A), and 5A (S199/205/207/208/213A) were transfected with GCaMP6mt into primary cortical neurons, and then, mitochondrial calcium changes were measured before and after triptolide treatment. Total cell number of each group: PACS2 WT = 39, PACS2 3A = 47, PACS2 4A = 42, PACS2 5A = 42. Scatter plots in F and G show the maximum amplitude of ΔF/F0 after triptolide stimulation. (H and I) In vitro kinase assay of GST-fused PACS2 middle region proteins, including WT, S205A, S207/208A, S213A, 3A, 4A, 5A, E211K, and recombinant CK2A1 protein. (H) The Left panel shows the Coomassie staining of GST-PACS2 (MR) proteins at approximately 75 kDa (black arrowhead) and GST protein at 25 kDa. Phosphorylated GST-PACS2 MR bands are shown in the Middle panel (short exposure time) and Lower panel (long exposure time). (I) Quantification data of the phosphorylated PACS2 (MR) band intensity normalized by protein loading. Data in line graphs demonstrate mean ± SEM. Scatter plots indicate mean ± SD. One-way ANOVA with Tukey’s post hoc tests for multiple comparisons was used to determine statistical significance. ns, not significant; *P < 0.05; **P < 0.01; ****P < 0.0001; #P < 0.05. Each experiment was conducted at least three times.