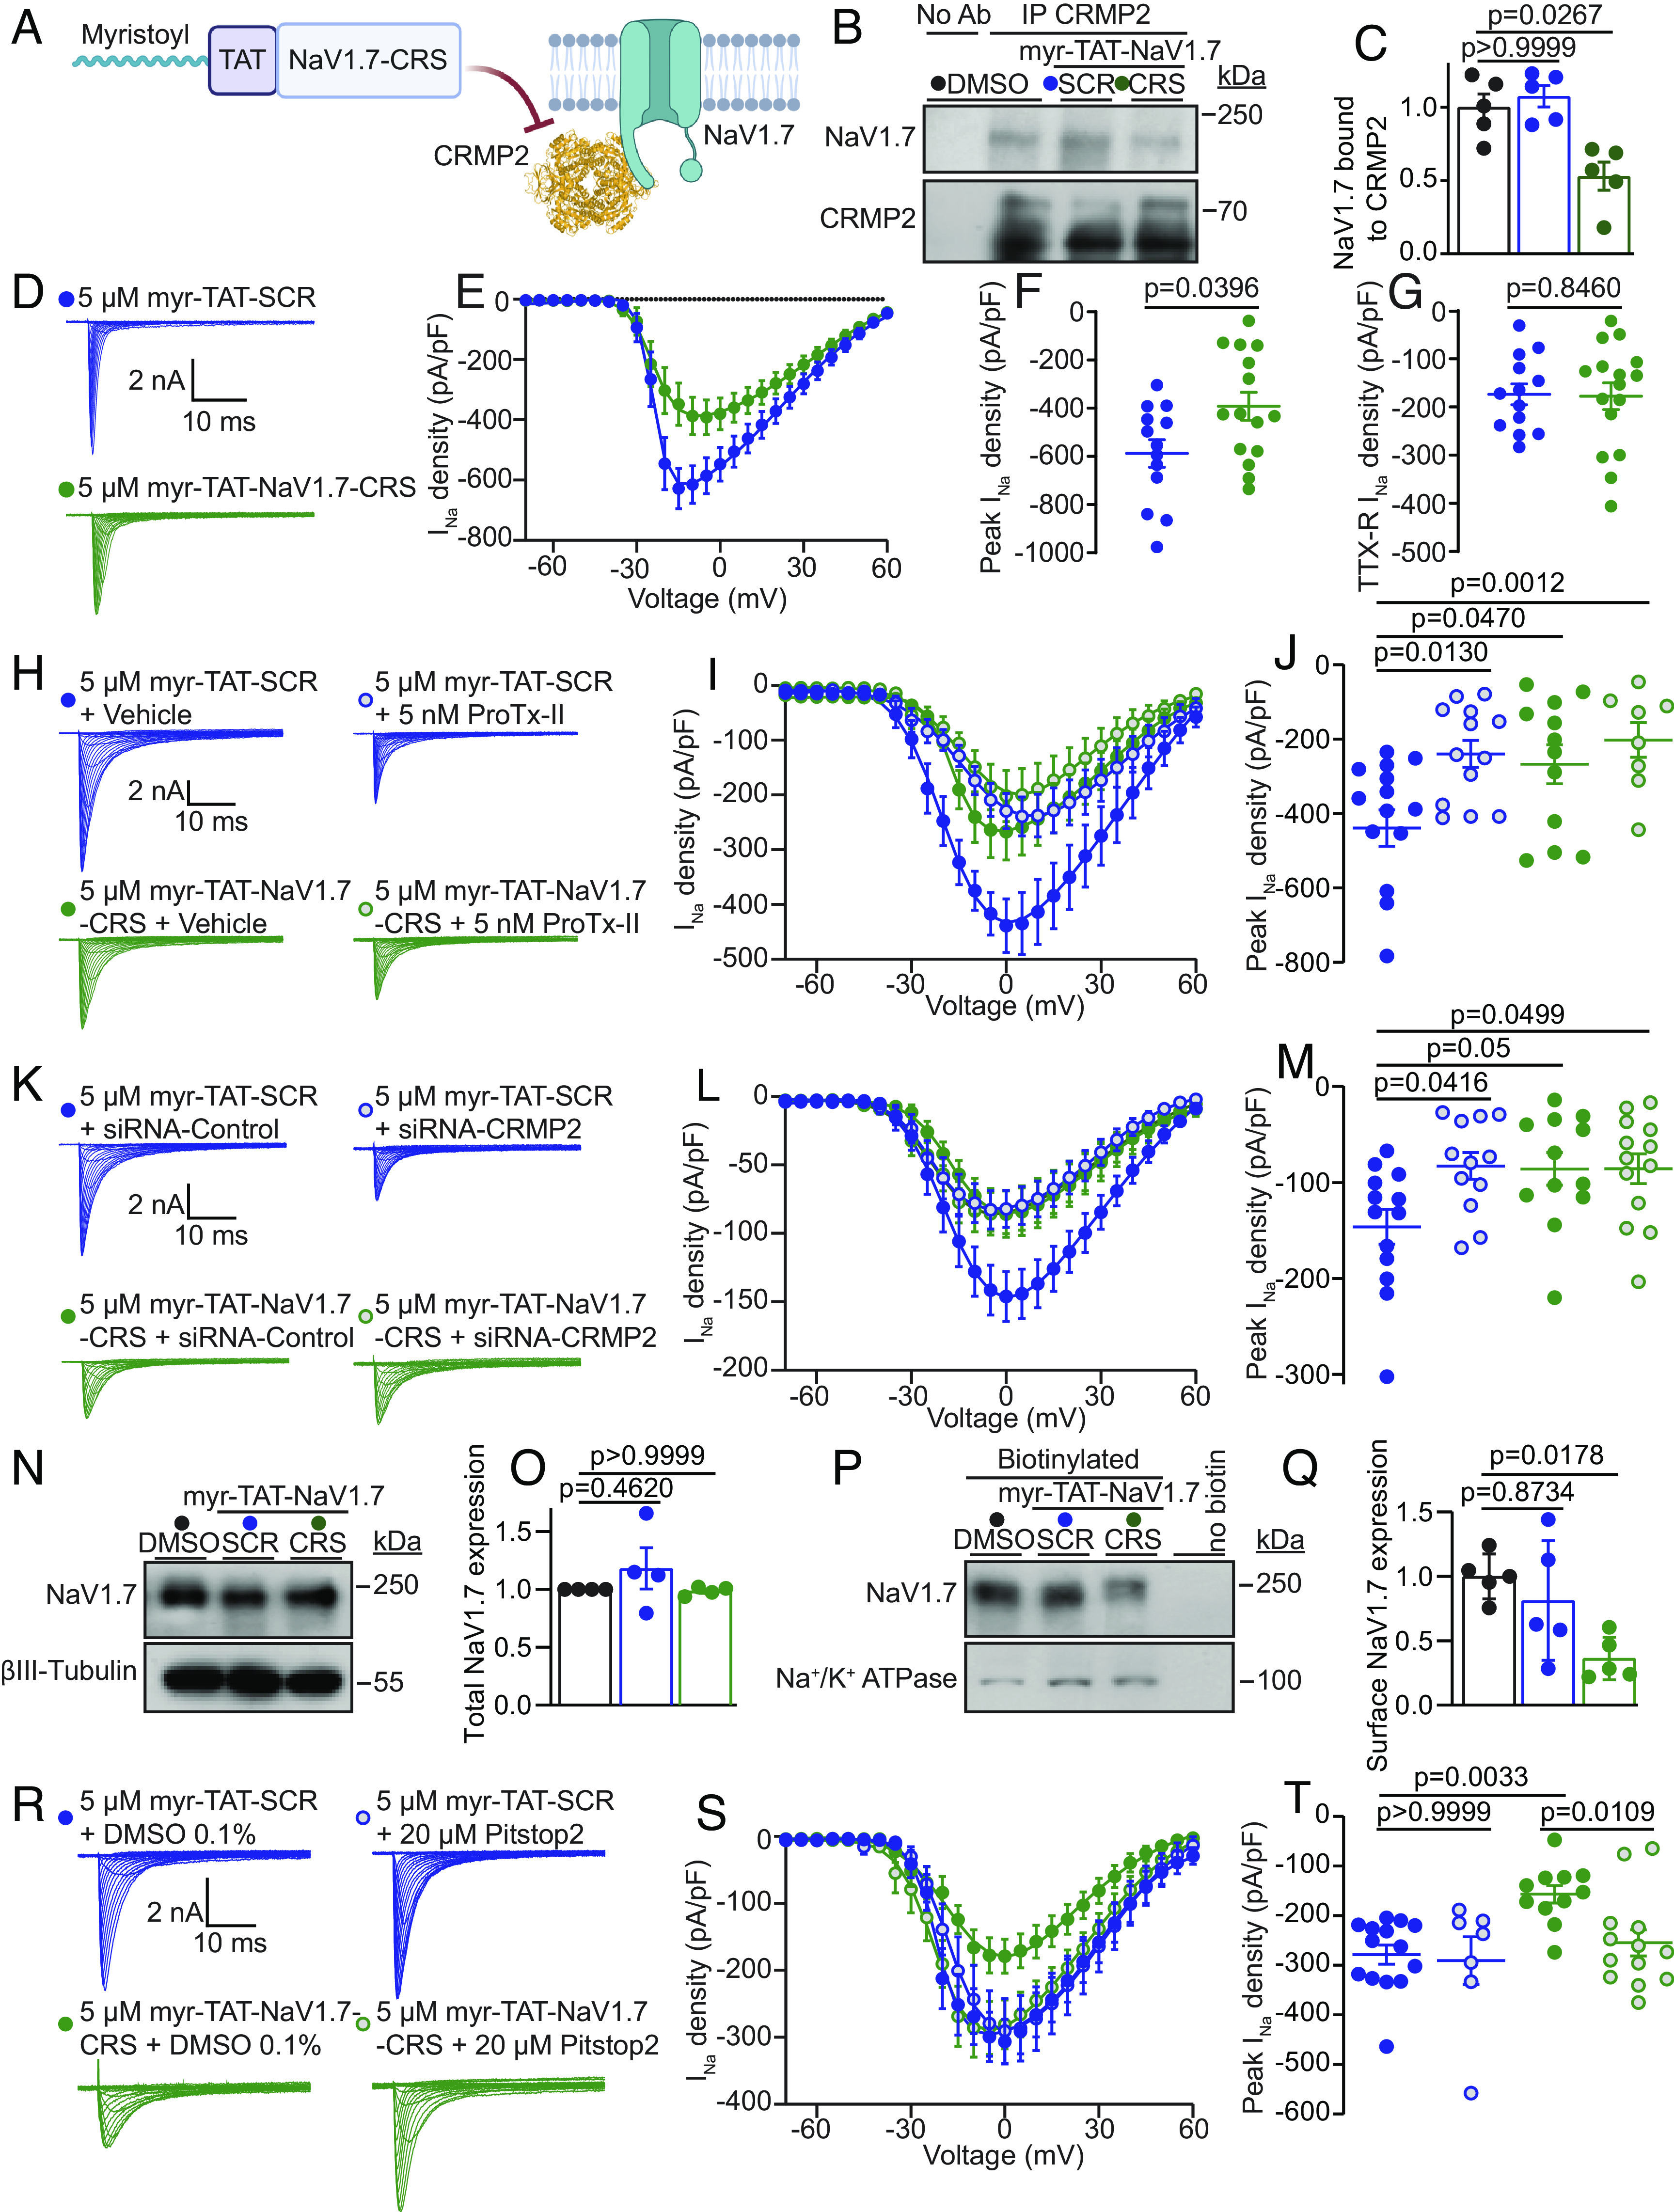
Fig. 2.

Myr-TAT-NaV1.7-CRS causes CRMP2 dependent reduction in NaV1.7 currents in DRG neurons. (A) The Myr-TAT-NaV1.7-CRS peptide competes for binding to NaV1.7 regulatory proteins. (B) Representative immunoblots and summary (C) of CRMP2 immunoprecipitation (IP) to detect NaV1.7 from CAD cells treated with the indicated peptides (n = 5). (D) Representative current traces recorded from small-sized DRG neurons in the presence of 5 µM Myr-TAT-SCR peptide (blue circles, n = 15) and Myr-TAT-NaV1.7-CRS peptide (green circles, n = 16). (E) Summary of Boltzmann fits for current density–voltage curves, (F) peak current densities, and (G) electrically isolated TTX-R currents. (H) Representative current traces recorded from small-sized DRGs incubated with Myr-TAT-SCR and Myr-TAT-NaV1.7-CRS in the presence and absence of the NaV1.7-specific inhibitor ProTx-II. (I) Boltzmann fits of the current density–voltage curves for each treatment group. (J) Summary of peak current densities. N = 8 to 12 cells; (K) representative current traces recorded from small-diameter DRGs transfected with either siRNA-Control or siRNA-CRMP2 and treated with Myr-TAT-NaV1.7-CRS or Myr-TAT-SCr as indicated. (L) Boltzmann fits for current density–voltage curves and (M) peak current densities. n = 12 to 13 cells; (N) representative immunoblots and (O) summary (Bottom) of NaV1.7 expression in CAD cells treated with the indicated peptides. βIII-Tubulin is used as a loading control (n = 4). (P) Representative immunoblots of streptavidin-enriched surface fractions probed for NaV1.7 and Na+/K+ ATPase as a control. (Q) Bar graph with scatter plot of mean surface localized NaV1.7 in CAD cells treated with the indicated peptides. (R) Representative current traces recorded from small-diameter DRG neurons in the presence of Myr-TAT-SCR or Myr-TAT-NaV1.7-CRS ± 20 µM Pitstop2 as indicated; (S) Boltzmann fits for current density-voltage curves and (T) summary of peak current densities (pA/pF) showing pitsopt2 blocked the current reduction imposed by Myr-TAT-NaV1.7-CRS. n = 7 to 14 cells; error bars indicate mean ± SEM; P values as indicated; Kruskal–Wallis test with Dunnett’s post hoc comparisons (Dataset S1). All biophysical parameters are shown in SI Appendix, Table S2 and statistical comparisons shown in Dataset S1. CRS—CRMP2 regulatory sequence; SCR—Scrambled control peptide (Sequence: KYHPWACFRQWRSPK).
