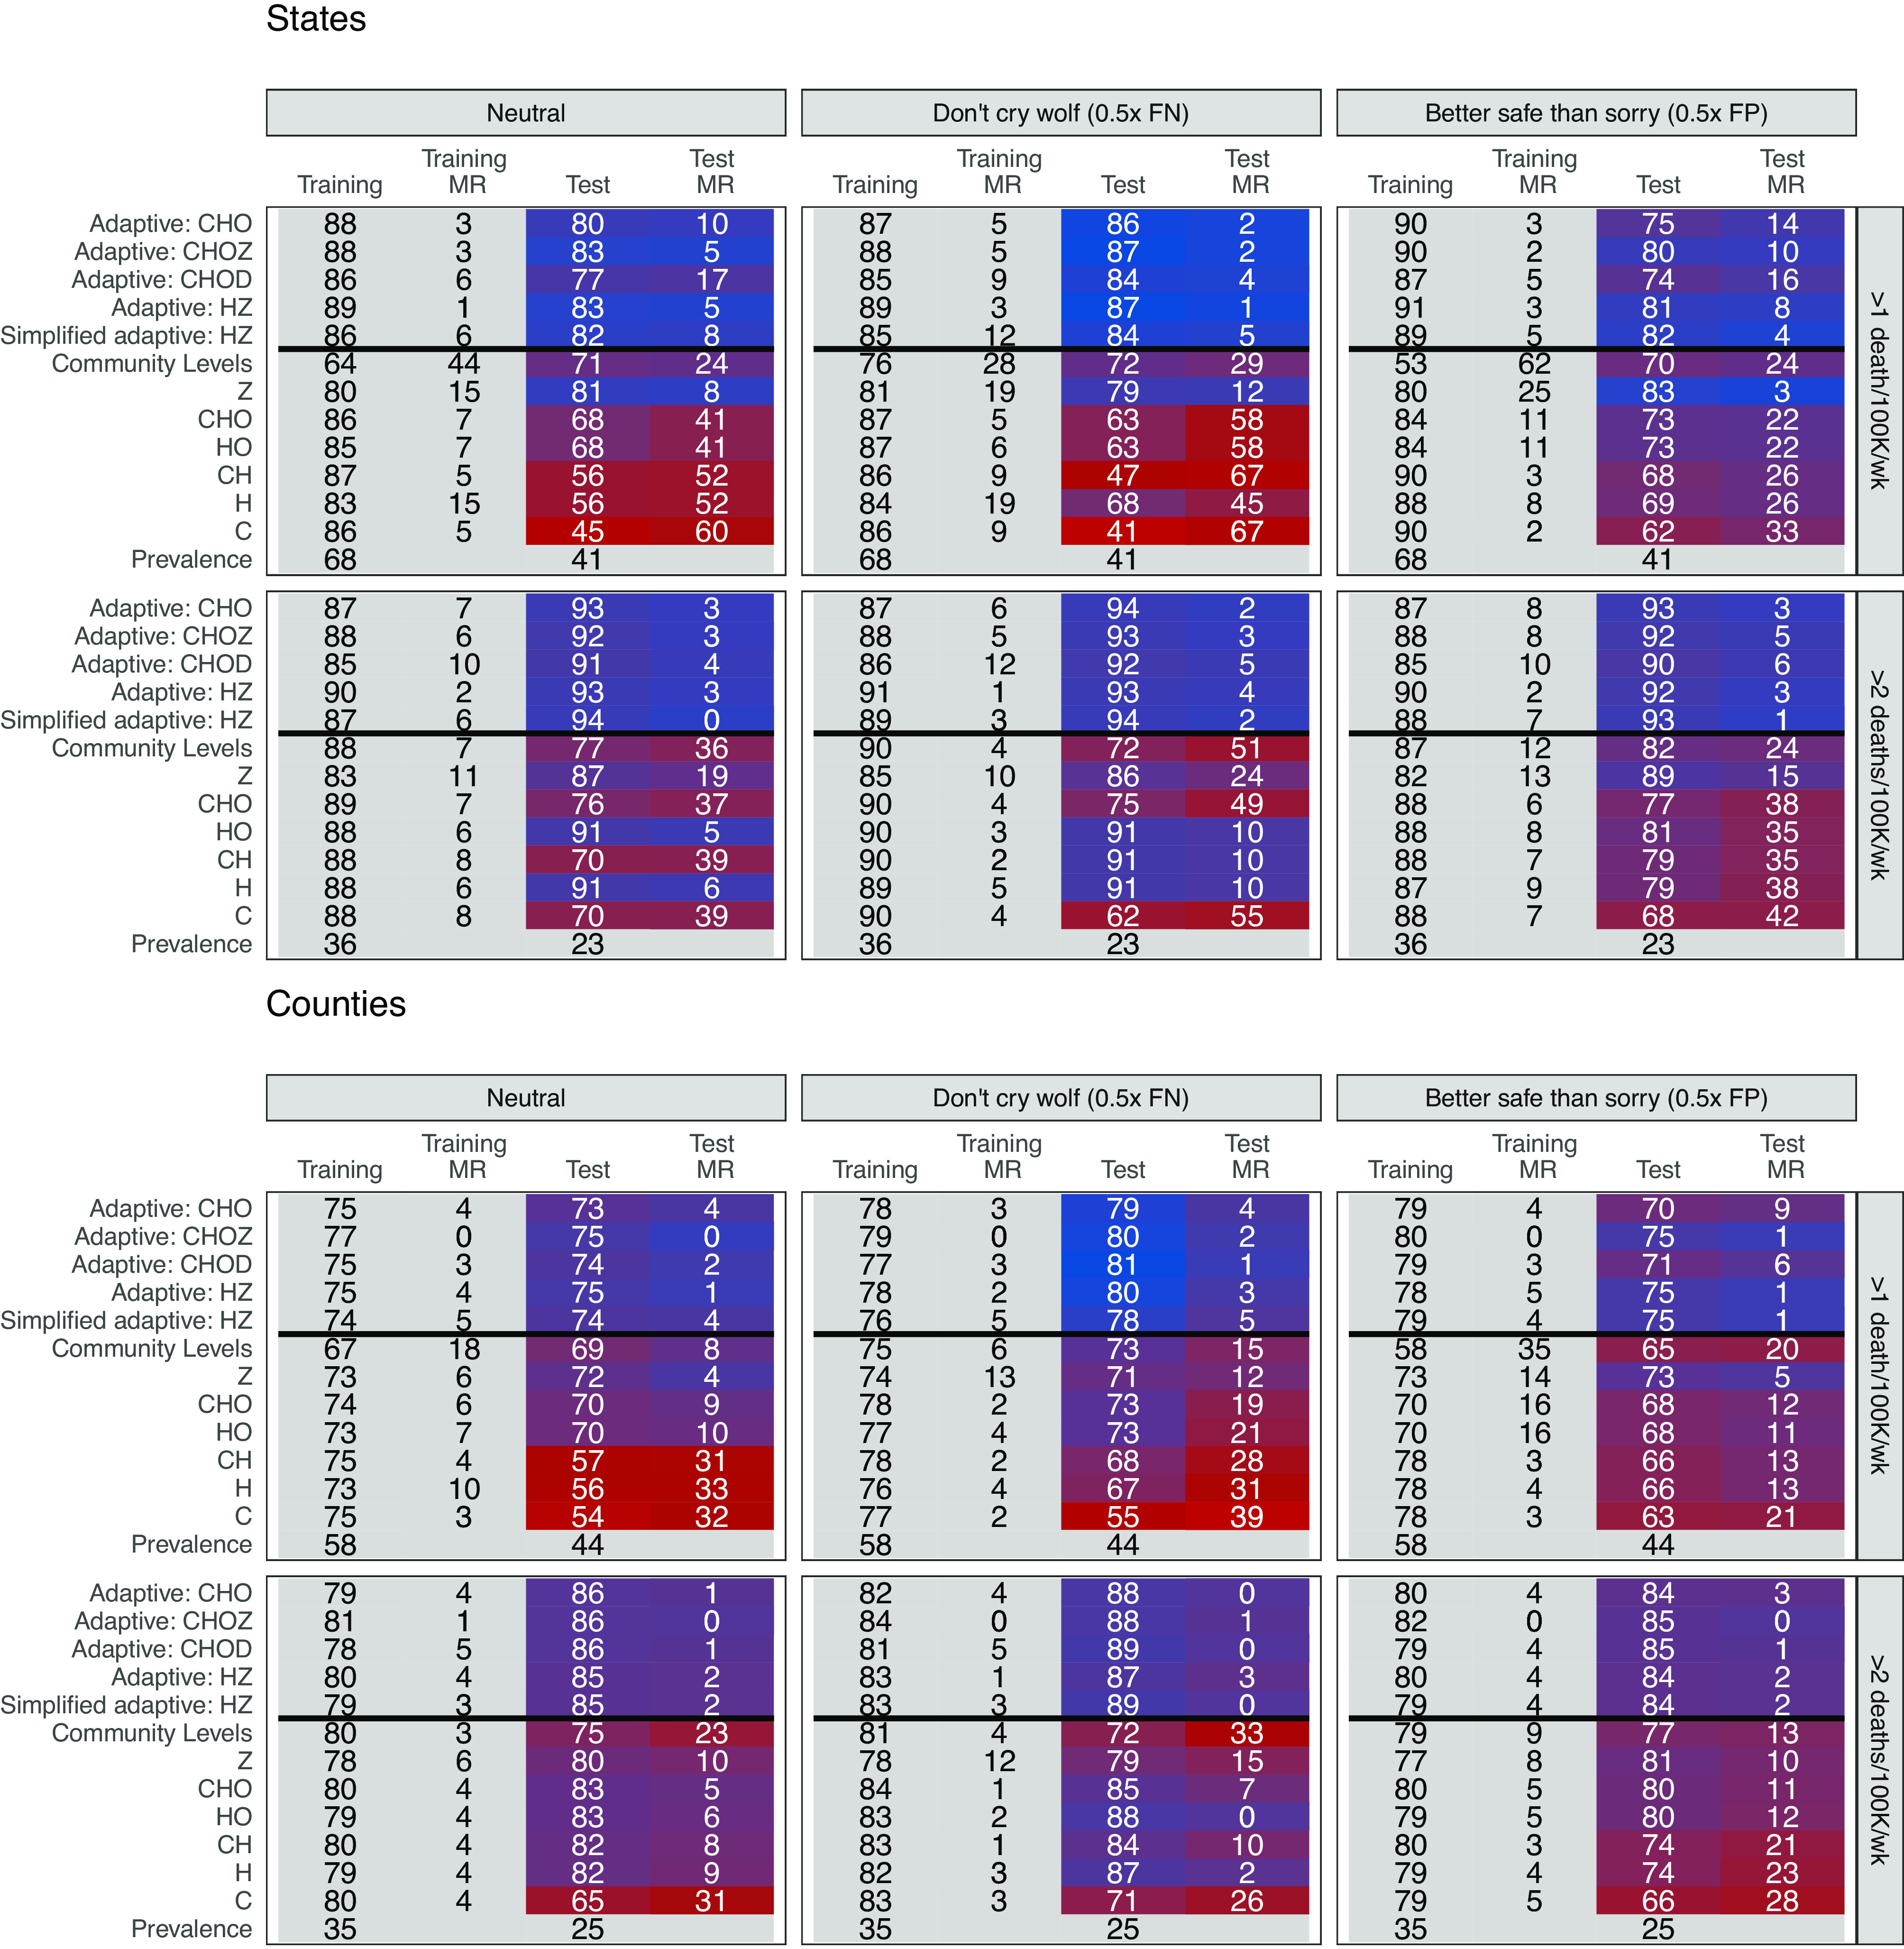
Fig. 3.

Head-to-head comparison results. The top plots display results from state-level analyses and the bottom plots display results from county-level analyses, both weighted for population. Metrics are displayed on the Left, with training data from Q2–Q4 2021 and test data from Q1–Q3 2022. Cells report weighted accuracy and maximum regret (MR) over training and test periods. Rows vary outcomes, and columns vary preferences for false positives versus false negatives, with “neutral” corresponding to unweighted accuracy. Prevalence indicates the proportion of high location-weeks in a given time period. A version including HSA-level analyses can be found in SI Appendix, Fig. S4. Secondary outcomes are presented in SI Appendix, Fig. S5, and weighted accuracy by quarter is presented in SI Appendix, Figs. S6–S8. For adaptive metrics, models vary functional form to include: 1) CHO (cases, hospitalizations, inpatient bed occupancy); 2) CHOZ (cases, hospitalizations, inpatient bed occupancy, current risk designation); 3) CHOD (cases, hospitalizations, inpatient bed occupancy, weekly changes in each indicator); 4) HZ (hospitalizations, current risk designation); 5) Simplified HZ (hospitalizations, current risk designation—updated quarterly). (For additional adaptive functional forms, SI Appendix, Fig. S9.)
