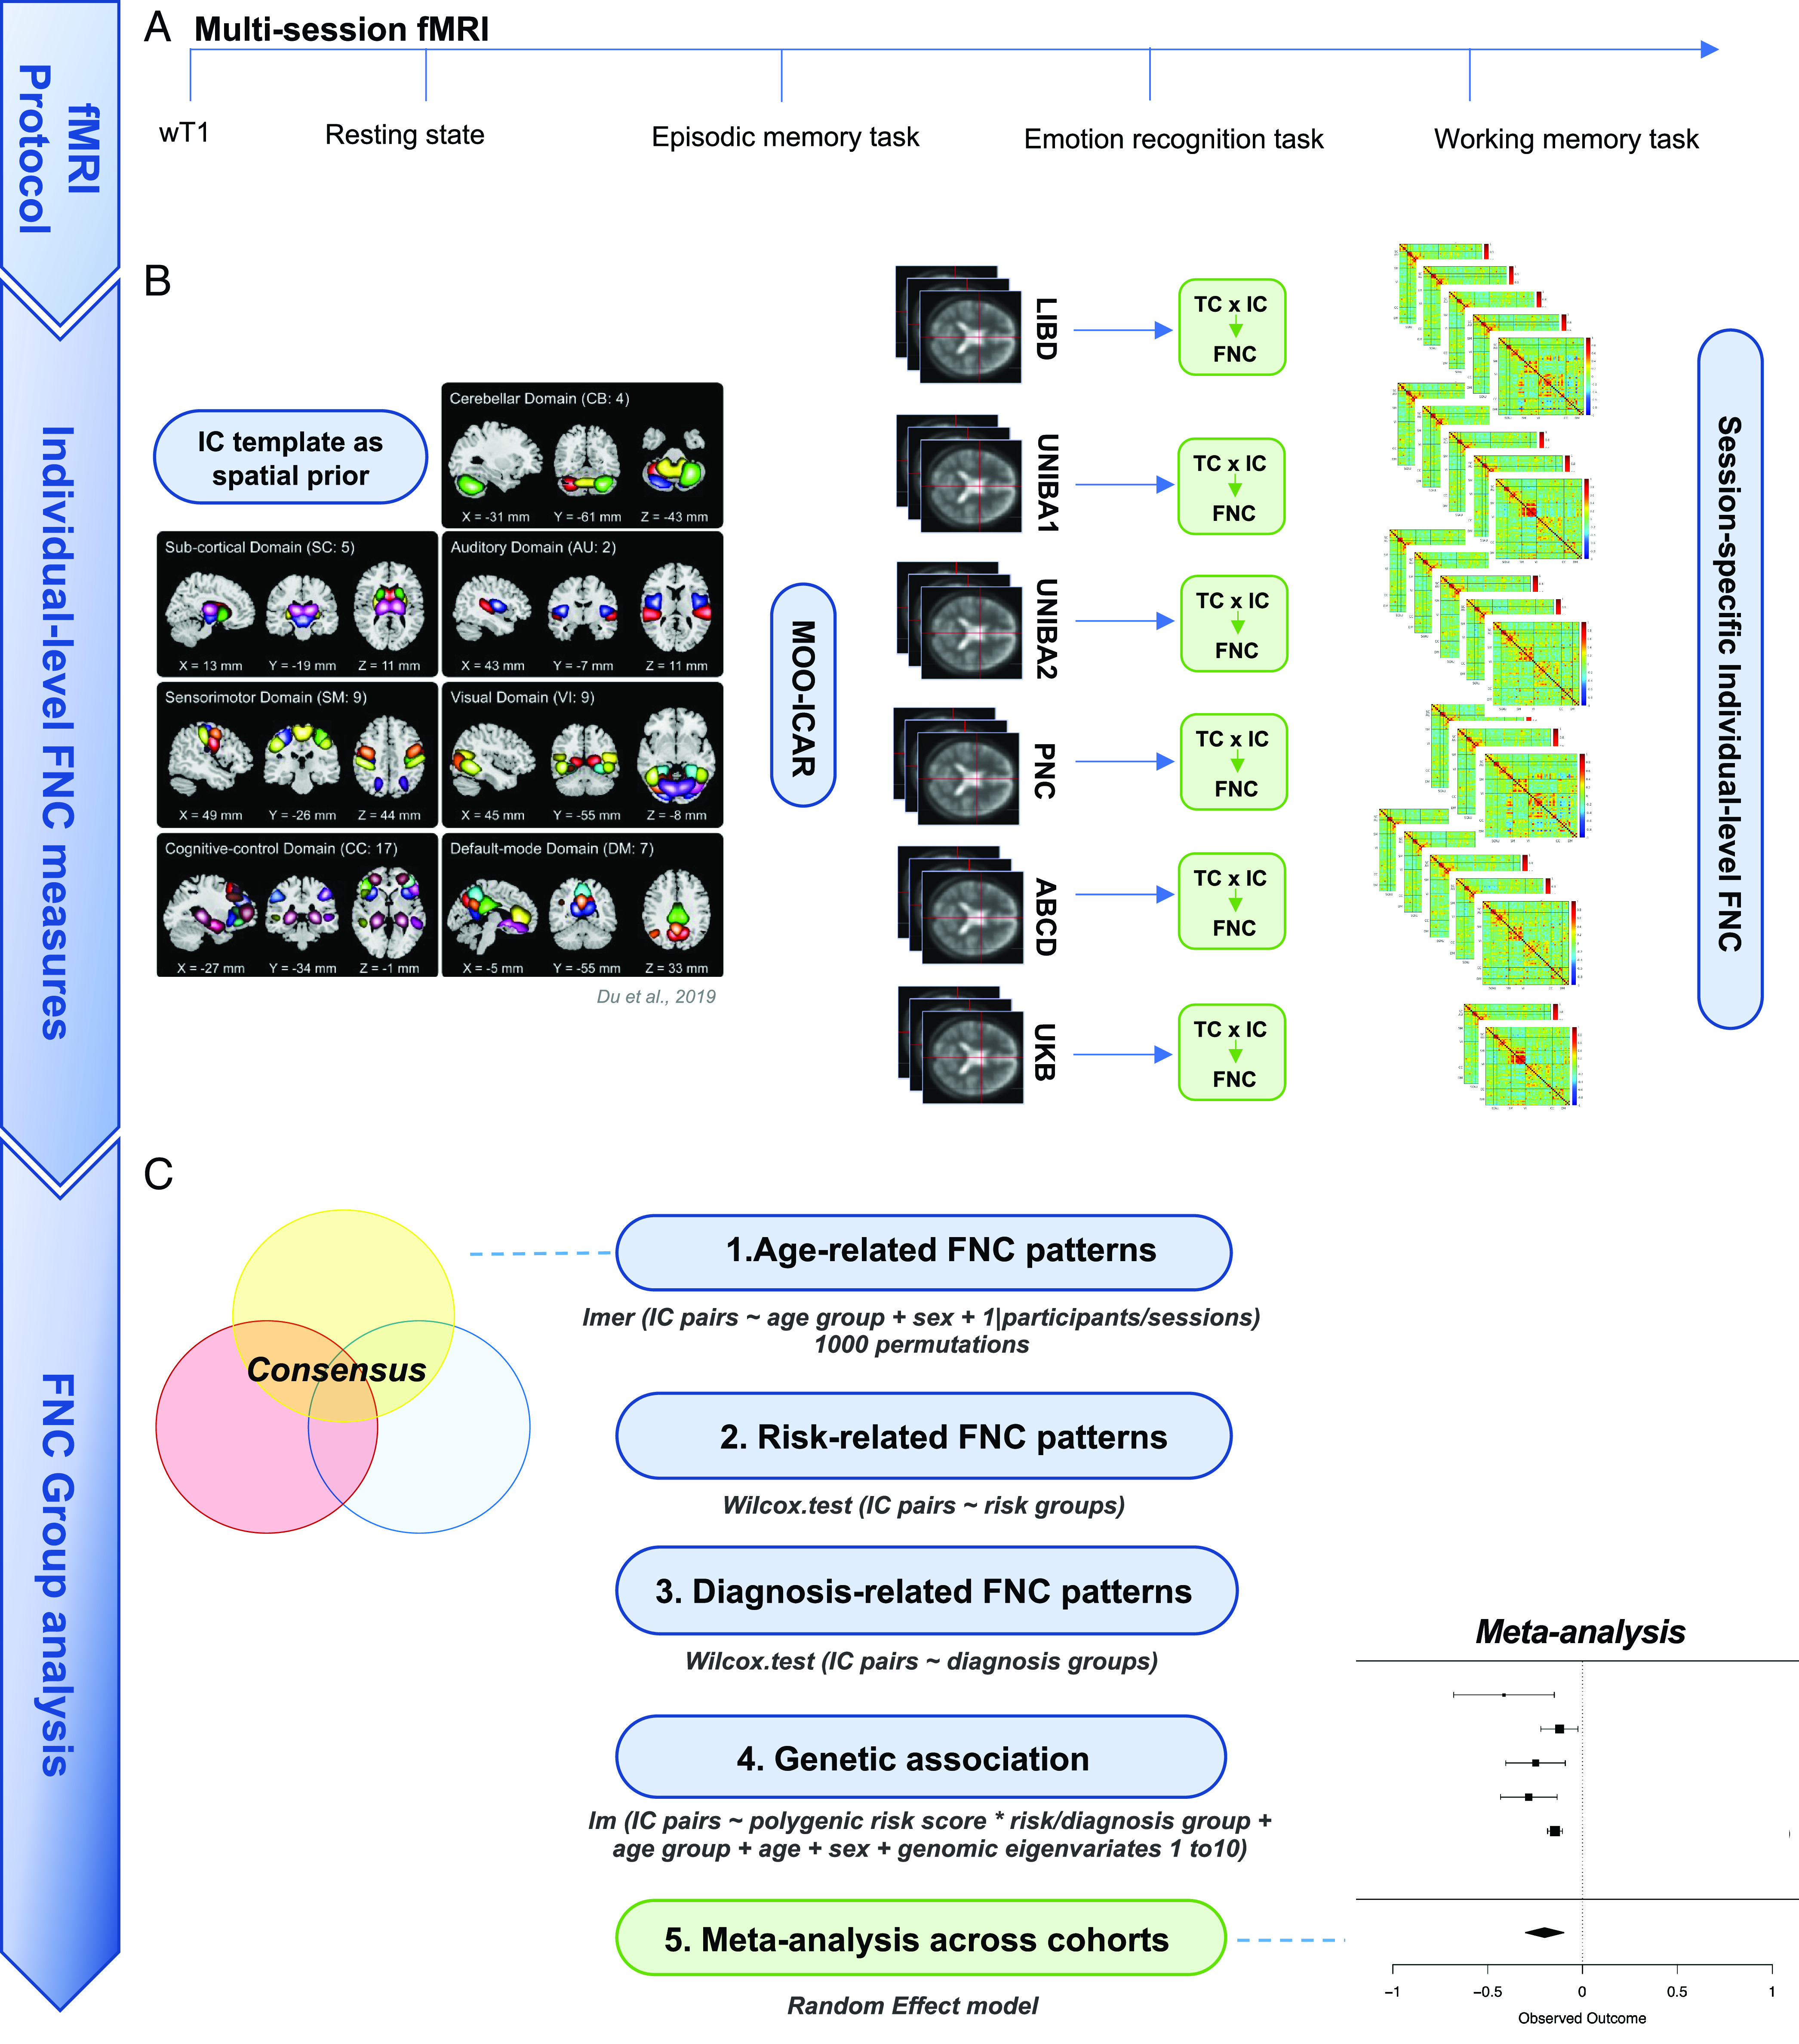
Fig. 1.

Chart describing the outline of this study including (A) the multisession fMRI protocol, (B) the individual-level FNC matrices determination through the application of the MOO-ICAR Algorithm [Du et al. (41)] on each fMRI session, (C) the group analysis on (1) the age-related FNC, (2) the familial risk–related FNC and, subsequently, the clinical risk–related FNC, (3) the SCZ-related FNC, (4) the genetic analysis PRS × FNC across groups within cohorts, and (5) the meta-analysis on the association PRS × FNC across cohorts.
