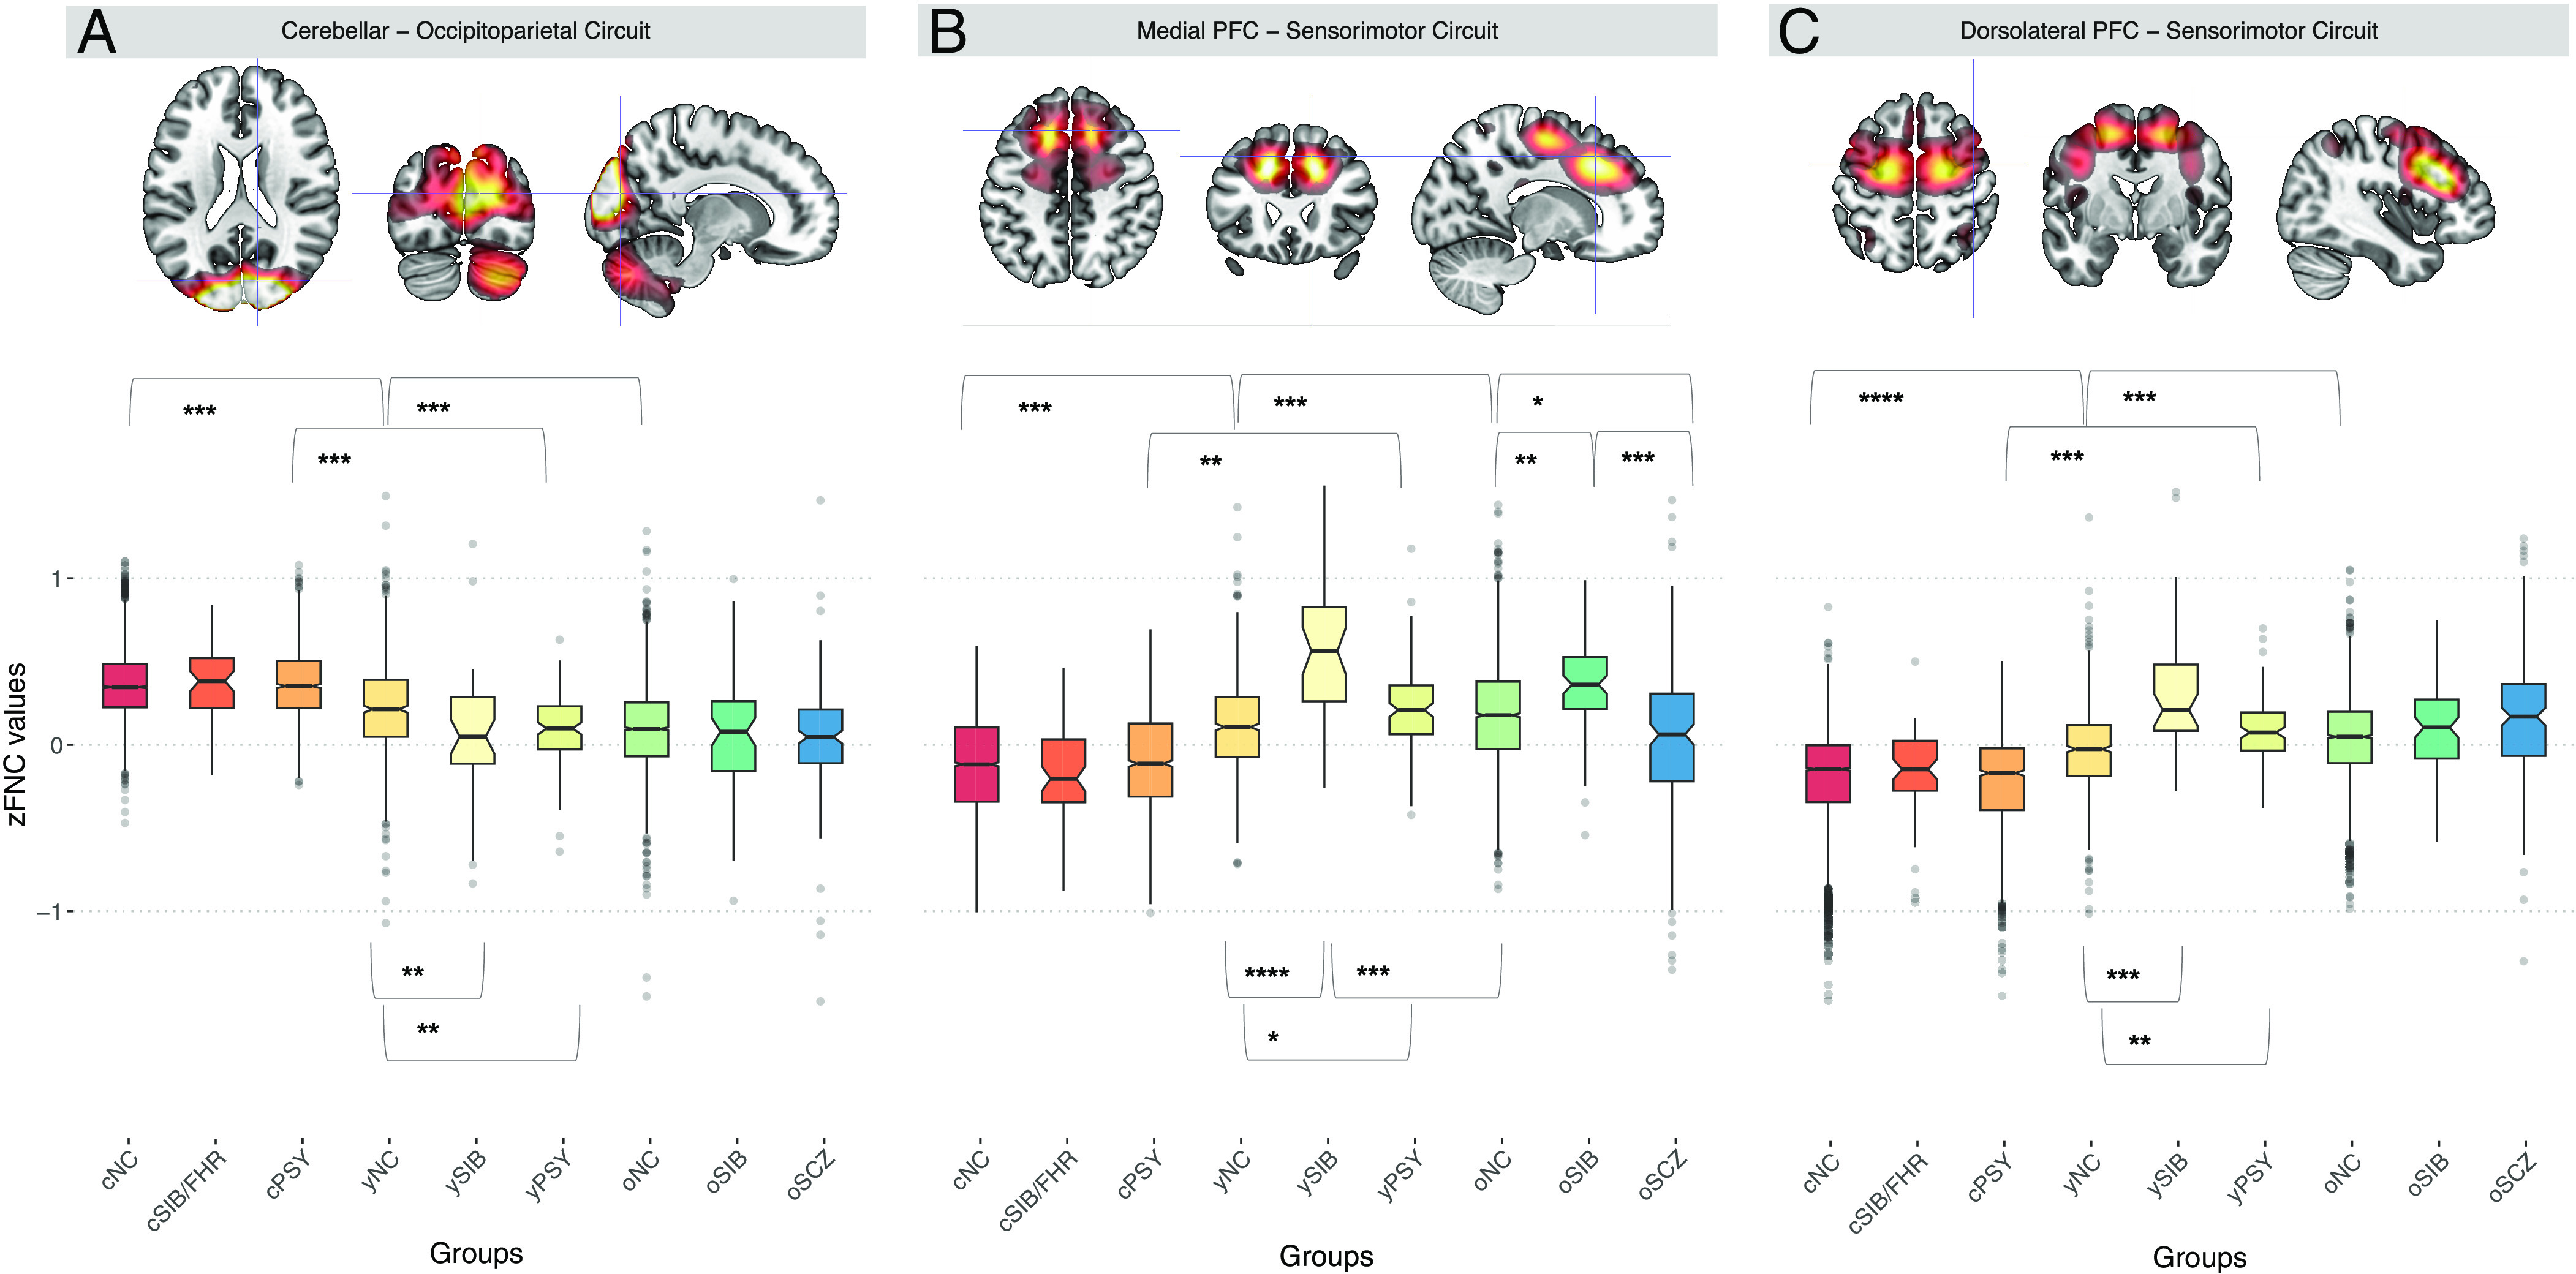
Fig. 3.

Brain sections depicting the (A) cerebellar–occipitoparietal circuit and the (B) medial and (C) dorsolateral PFC circuits. Boxplots showing differences on averaged FNC across sessions among risk-related IC pairs comparing all groups, i.e., cNC, yNC, oNC, cSIB/FHR, ySIB, oSIB, cPSY, yPSY, and oSCZ. Significant differences in each of the three cohorts are indicated with asterisks. Different colors represent different groups: cNC (red), cSIB/FHR (orange), cPSY (light orange), yNC (dark yellow), ySIB (yellow), yPSY (light green), oNC (green), oSIB (dark green), and oSCZ (blue).
