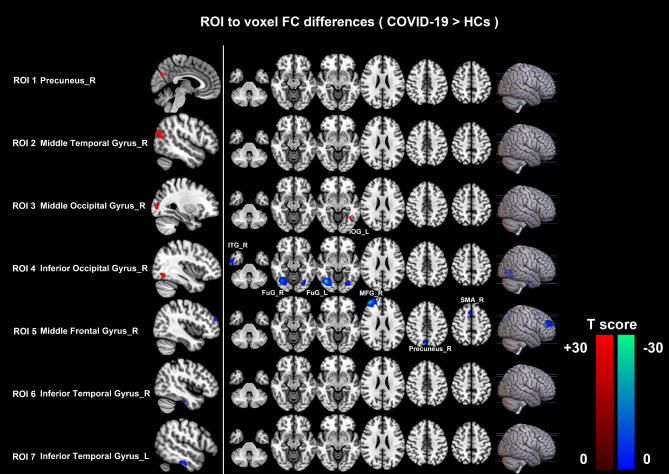
Fig. 3.
Abnormalities in the seed-based functional connectivity. Red regions showed increased FC values, and Blue regions showed decreased FC values in the recovered COVID-19 patients. The difference was calculated by two-tailed two-sample t-test, and the results were FDR-corrected (P < 0.05). FC, functional connectivity; HCs, healthy controls; ROI, region of interest; R, right; L, left; IOG_L, left inferior occipital gyrus (visual processing); ITG_R, right inferior temporal gyrus (visual processing); FuG_R, right fusiform gyrus (visual processing); FuG_L, left fusiform gyrus (visual processing); MFG_R, right middle frontal gyrus (executive functioning, working memory, attention); SMA_R, right supplementary motor area (language, motor); Precuneus_R, right precuneus (visual information, memory, attention)

