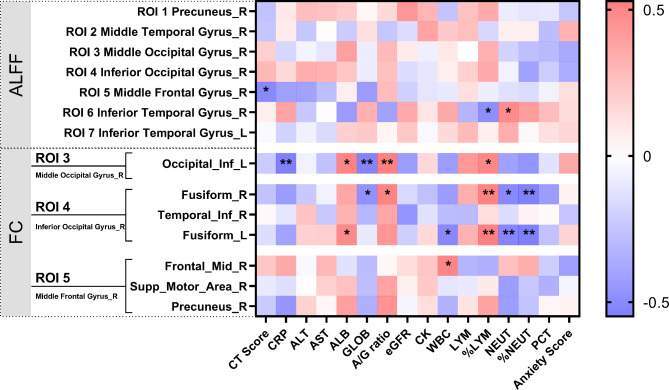
Fig. 4.
Spearman correlations between brain function alterations and clinical indicators. Different colors in the figure showed the Spearman correlation coefficient. ALFF, amplitude of low-frequency fluctuations; FC, functional connectivity; ROI, region of interest; R, right; L, left; CRP, C-reactive protein; ALT, alanine aminotransferase, AST, aspartate aminotransferase; ALB, albumin; GLOB, globulin; A/ G ratio, albumin/ globulin ratio; eGFR, glomerular filtration rate; CK, creatine kinase; WBC, white blood cell; LYM, lymphocytes; %LYM, percentage of LYM; NEUT, neutrophil; %NEUT, percentage of NEUT; PCT, procalcitonin. *, Significant level P < 0.05; **, Significant level P < 0.01

