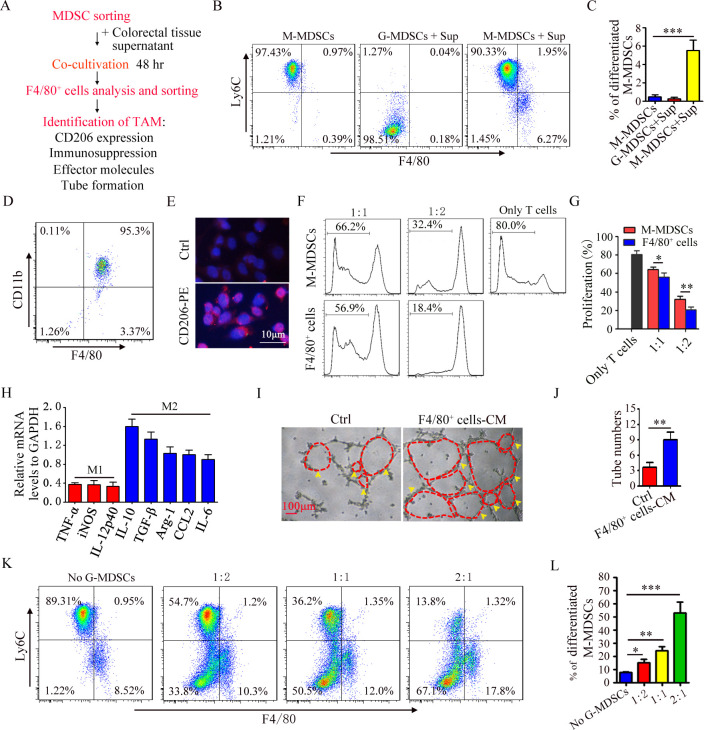
Figure 2.
G-MDSCs pomote the differentiation of M-MDSC into M2 macrophages. (A) Flow chart of inducing M-MDSCs to differentiate into M2 macrophages. (B) FACS analysis of the percentage of CD11b+Ly6Chi cell and CD11b+Ly6Clow cell. (C) Summary graphs of the percentage of differentiated M-MDSCs (F4/80+Ly6Clow cells) to total M-MDSCs. (D) FACS analysis of sorted CD11b+F4/80+ cells. (E) Immunofluorescence analysis of CD206 in CD11b+F4/80+ cells. (F) T cell proliferation was detected using FACS. (G) Summary graphs of the percentage of proliferating T cells (n=3). (H) mRNA expression of cytokines in CD11b+F4/80+ cells was analyzed by qRT-PCR (n=3). (I) Representative results of tube formation (n=3). (J) Summary graphs of tube number (n=3). (K) The percentage of F4/80+Ly6Clow cell were detected by FACS (n=3). (L) Summary graphs of the percentage of differentiated M-MDSC to total M-MDSC (n=3). Statistical analyses were performed using unpaired t-tests. G-MDSCs, colitis-associated cancers; MDSC, myeloid-derived suppressor cell; M-MDSCs, monocytic MDSCs. (*p<0.05, **p<0.01, ***p<0.001,one-way ANOVA test; error bars, SD).

