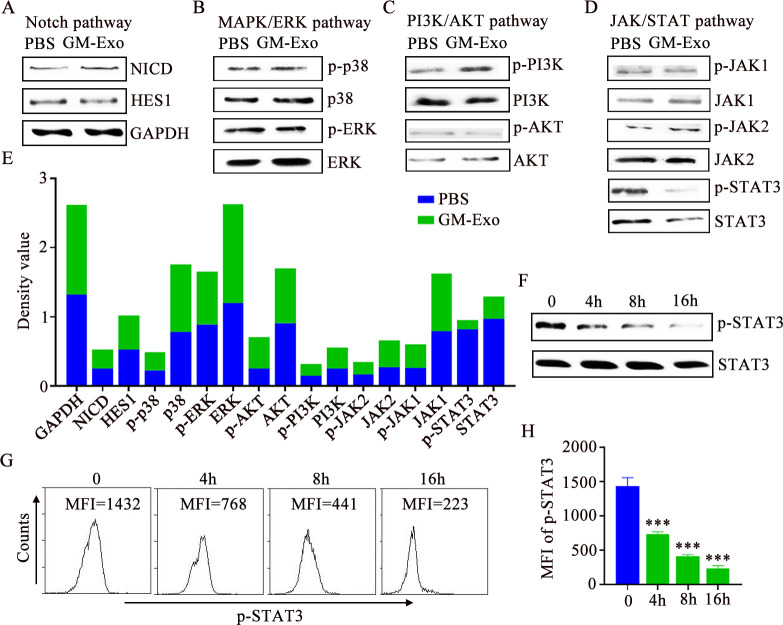
Figure 4.
GM-Exo downregulate the STAT3 activity in M-MDSC. (A–D) Signaling proteins were analyzed by IB analysis (n=3). (E) Optical density values of proteins. (F) IB analysis of p-STAT3 and STAT3 in M-MDSCs (n=3). (G) Representative result of p-STAT3 MFI value in M-MDSC (n=3). (H) Summary graphs of p-STAT3 MFI values (n=3). tatistical analyses were performed using unpaired t-tests. M-MDSCs, monocytic myeloid-derived suppressor cells. (***p<0.001, one-way ANOVA test; error bars, SD). MFI, mean fluorescence intensity; PBS, phosphate buffer saline; GAPDH, glyceraldehyde-3-phosphate dehydrogenase

