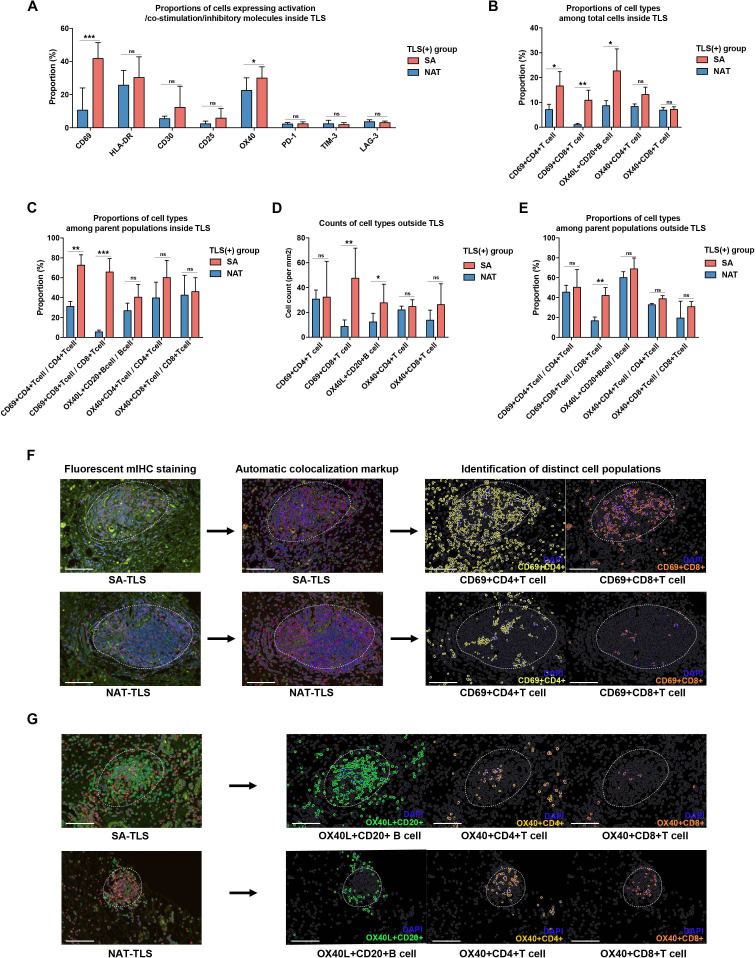
Figure 7.
Comparison of activated immune cell populations within or outside intratumoral tertiary lymphoid structures (TLSs) between the surgery alone (SA) and neoadjuvant treatment (NAT) cohorts. (A) Proportions of cells expressing different activation, costimulation and inhibitory markers among all the measured cells within intratumoral TLSs; *p<0.05, **p<0.01, *p<0.05, ***p<0.001. (B) Proportions of activated immune cell types among total cells within TLSs. (C) Proportions of activated immune cell types among parent populations within TLSs. (D) Infiltration levels of activated immune cell types outside TLSs. (E) Proportions of activated immune cell types among parent populations outside TLSs. (F) Representative images for the identification of activated immune cell populations by automatic colocalization analysis; scale bar: 100 µm.

