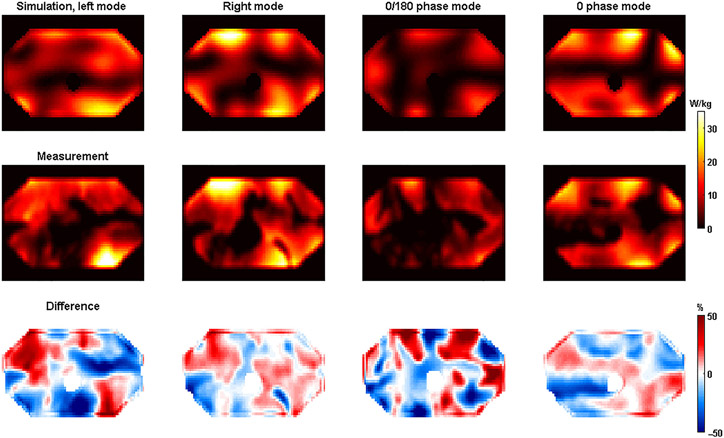
FIGURE 2.
Simulated (top) and measured (middle) SAR-maps for the 7-T body array. The relative difference between the two was calculated per voxel as (SAR,meas − SAR,sim)/SAR,sim,max. Difference maps calculated using Equation 8 are shown in the bottom row. SAR, specific absorption rate

