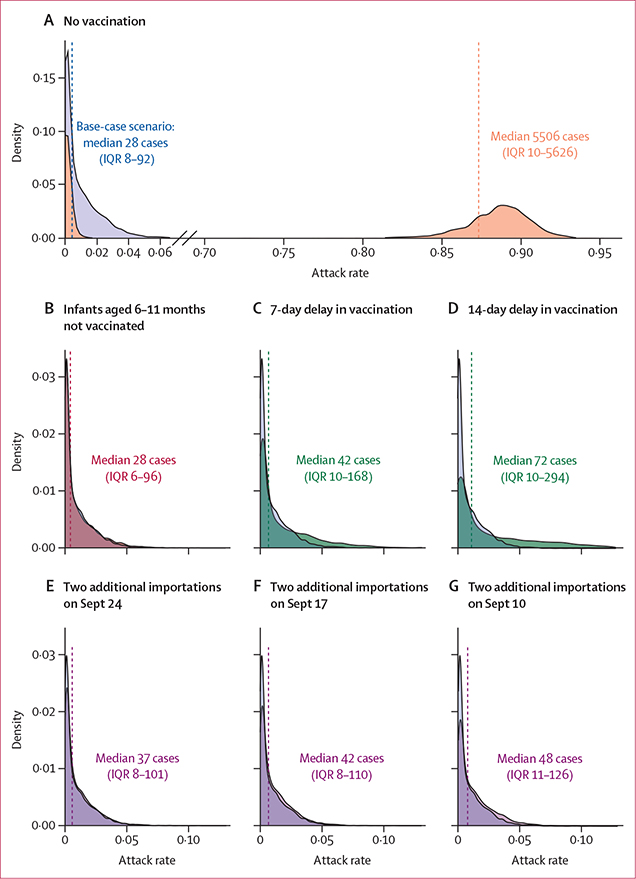
Figure 3: Model simulations of the probability distribution of measles attack rates among susceptible evacuees in five military bases with measles cases, under various scenarios.
(A) Mass vaccination not conducted, shown in orange (median attack rate 87·33%, IQR 0·15–89·23). (B) Age of measles, mumps, and rubella vaccine administration not lowered to 6 months (ie, those aged 6–11 months were not vaccinated, shown in red; median attack rate 0·44%, 0·10–1·53). (C) Vaccination delayed by 7 days (ie, vaccination uptake as it occurred but shifted by 7 days, shown in green; median attack rate 0·68%, 0·15–2·66). (D) Vaccination delayed by 14 days (ie, vaccination uptake as it occurred but shifted by 14 days, shown in green; median attack rate 1·14%, 0·15–4·67). (E–G) Two additional importations, one at Fort McCoy and one at MCB Quantico, on Sept 24 (median attack rate 0·58%, 0·12–1·61), Sept 17 (median attack rate 0·67%, 0·13–1·75), or Sept 10 (median attack rate 0·76%, 0·18–2·00); intervention scenarios are shown in purple. Each panel compares the base-case scenario (model results using vaccination uptake as it occurred), shown in blue (median attack rate 0·44%, IQR 0·12–1·46; in reality, 35 cases were observed in this outbreak across these five bases), with the modelled scenario. Vertical dashed lines represent median modelled cases. Five military bases with reported cases are included in these results (Fort McCoy, WI; MCB Quantico, VA; Holloman Air Force Base, NM; Joint Base McGuire-Dix-Lakehurst, NJ; and Fort Pickett, VA); total population, n=35 951, total estimated susceptible population, n=6305. Hotel A was modelled separately (appendix pp 19, 21). Medians and IQRs for the attack rates among susceptible evacuees and the total number of cases were generated from 1000 simulations per military base, which were pooled to create these combined estimates. MCB=Marine Corps Base.

