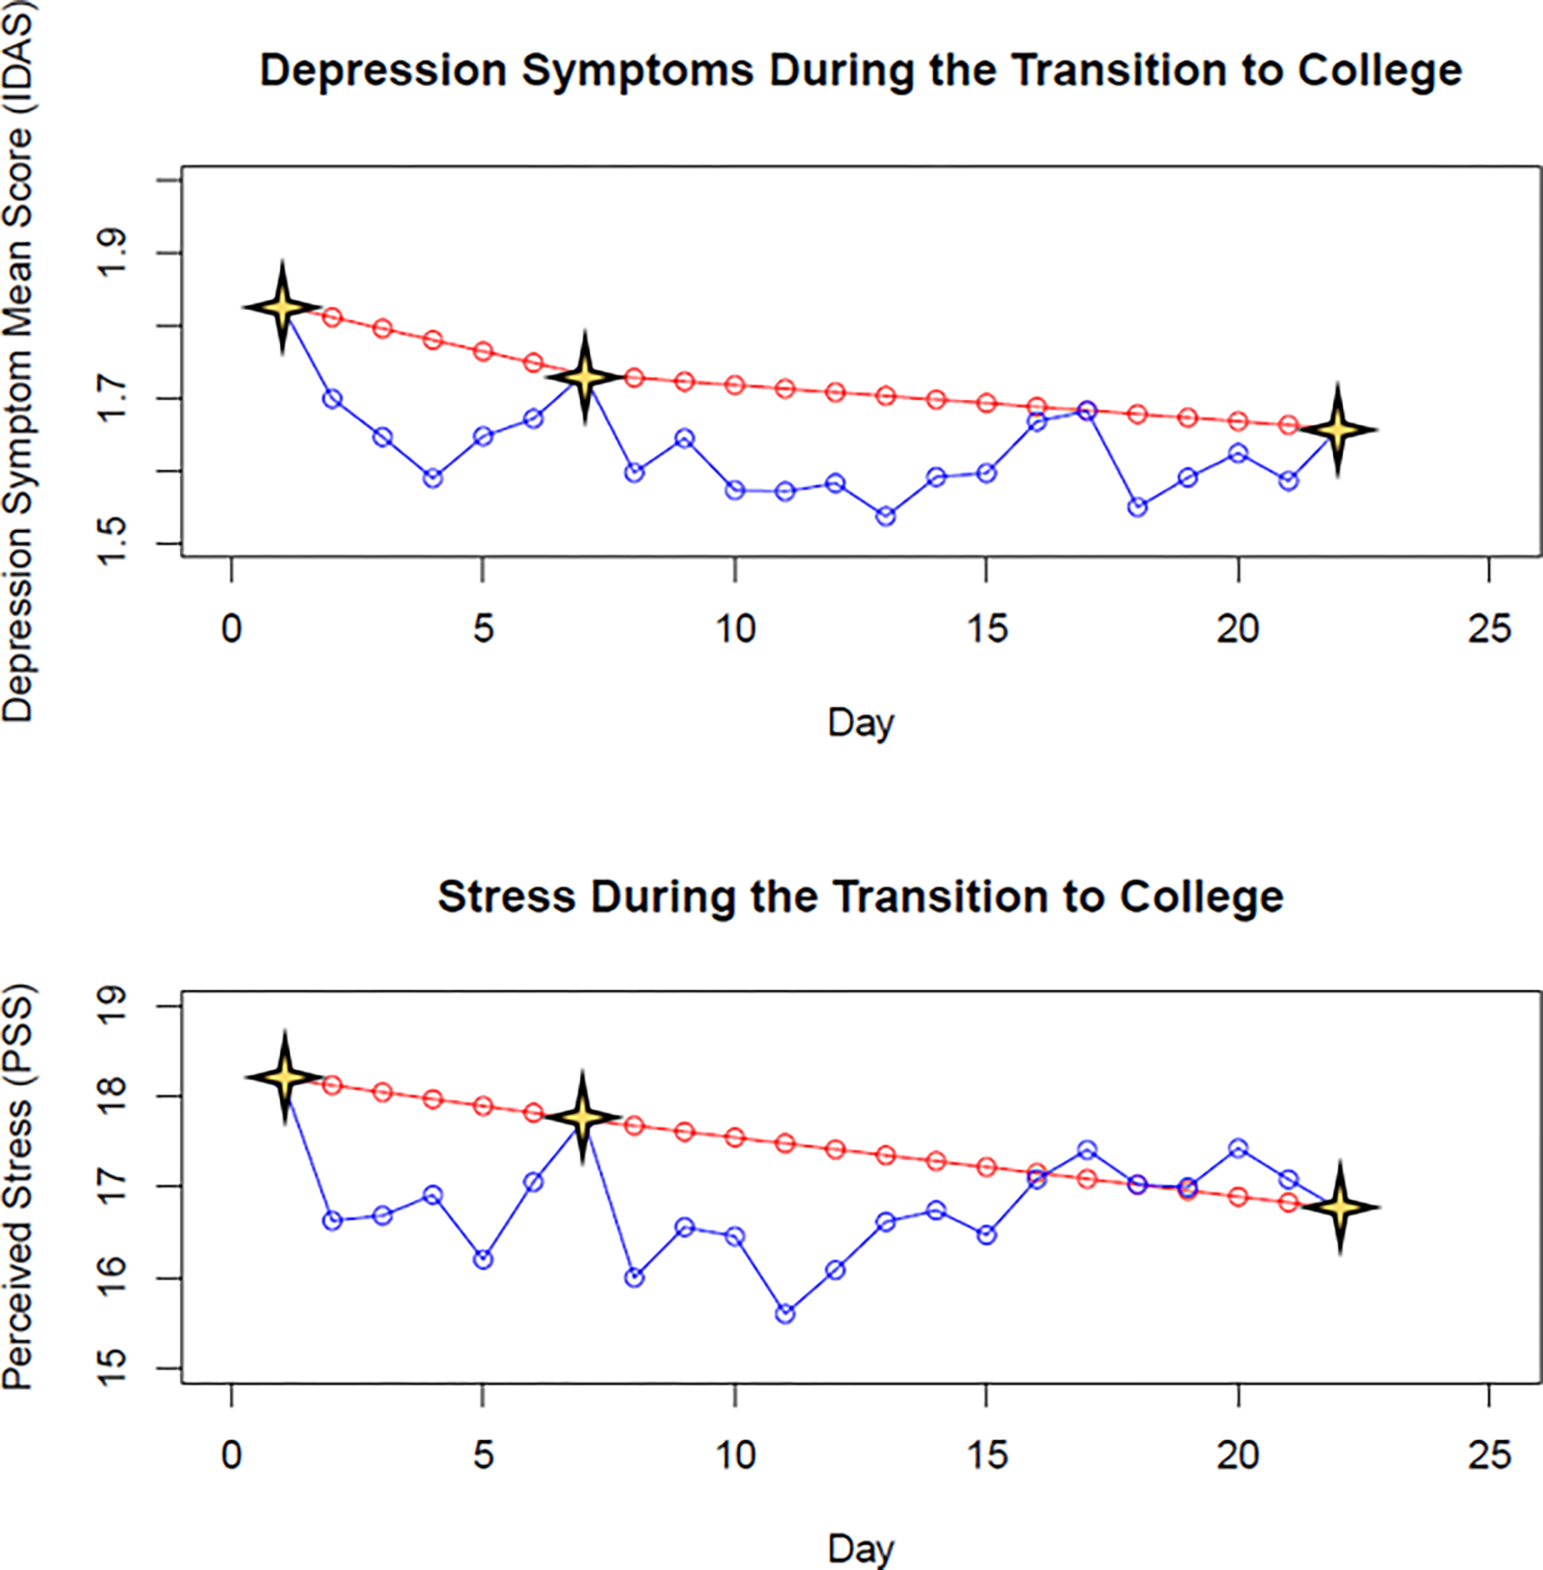
Figure 1. Trajectories of Depression Symptoms and Stress During the Transition to College.

Stars indicate the three primary events of the study—namely, study start, moving onto campus, and study end. The red lines illustrate the trajectories of depression symptoms and stress if data were only collected and analyzed at these event time points. The blue lines illustrate the actual daily fluctuations in depression symptom and stress data throughout the study. Note: IDAS = Inventory of Depression and Anxiety Symptoms; PSS = Perceived Stress Scale.
