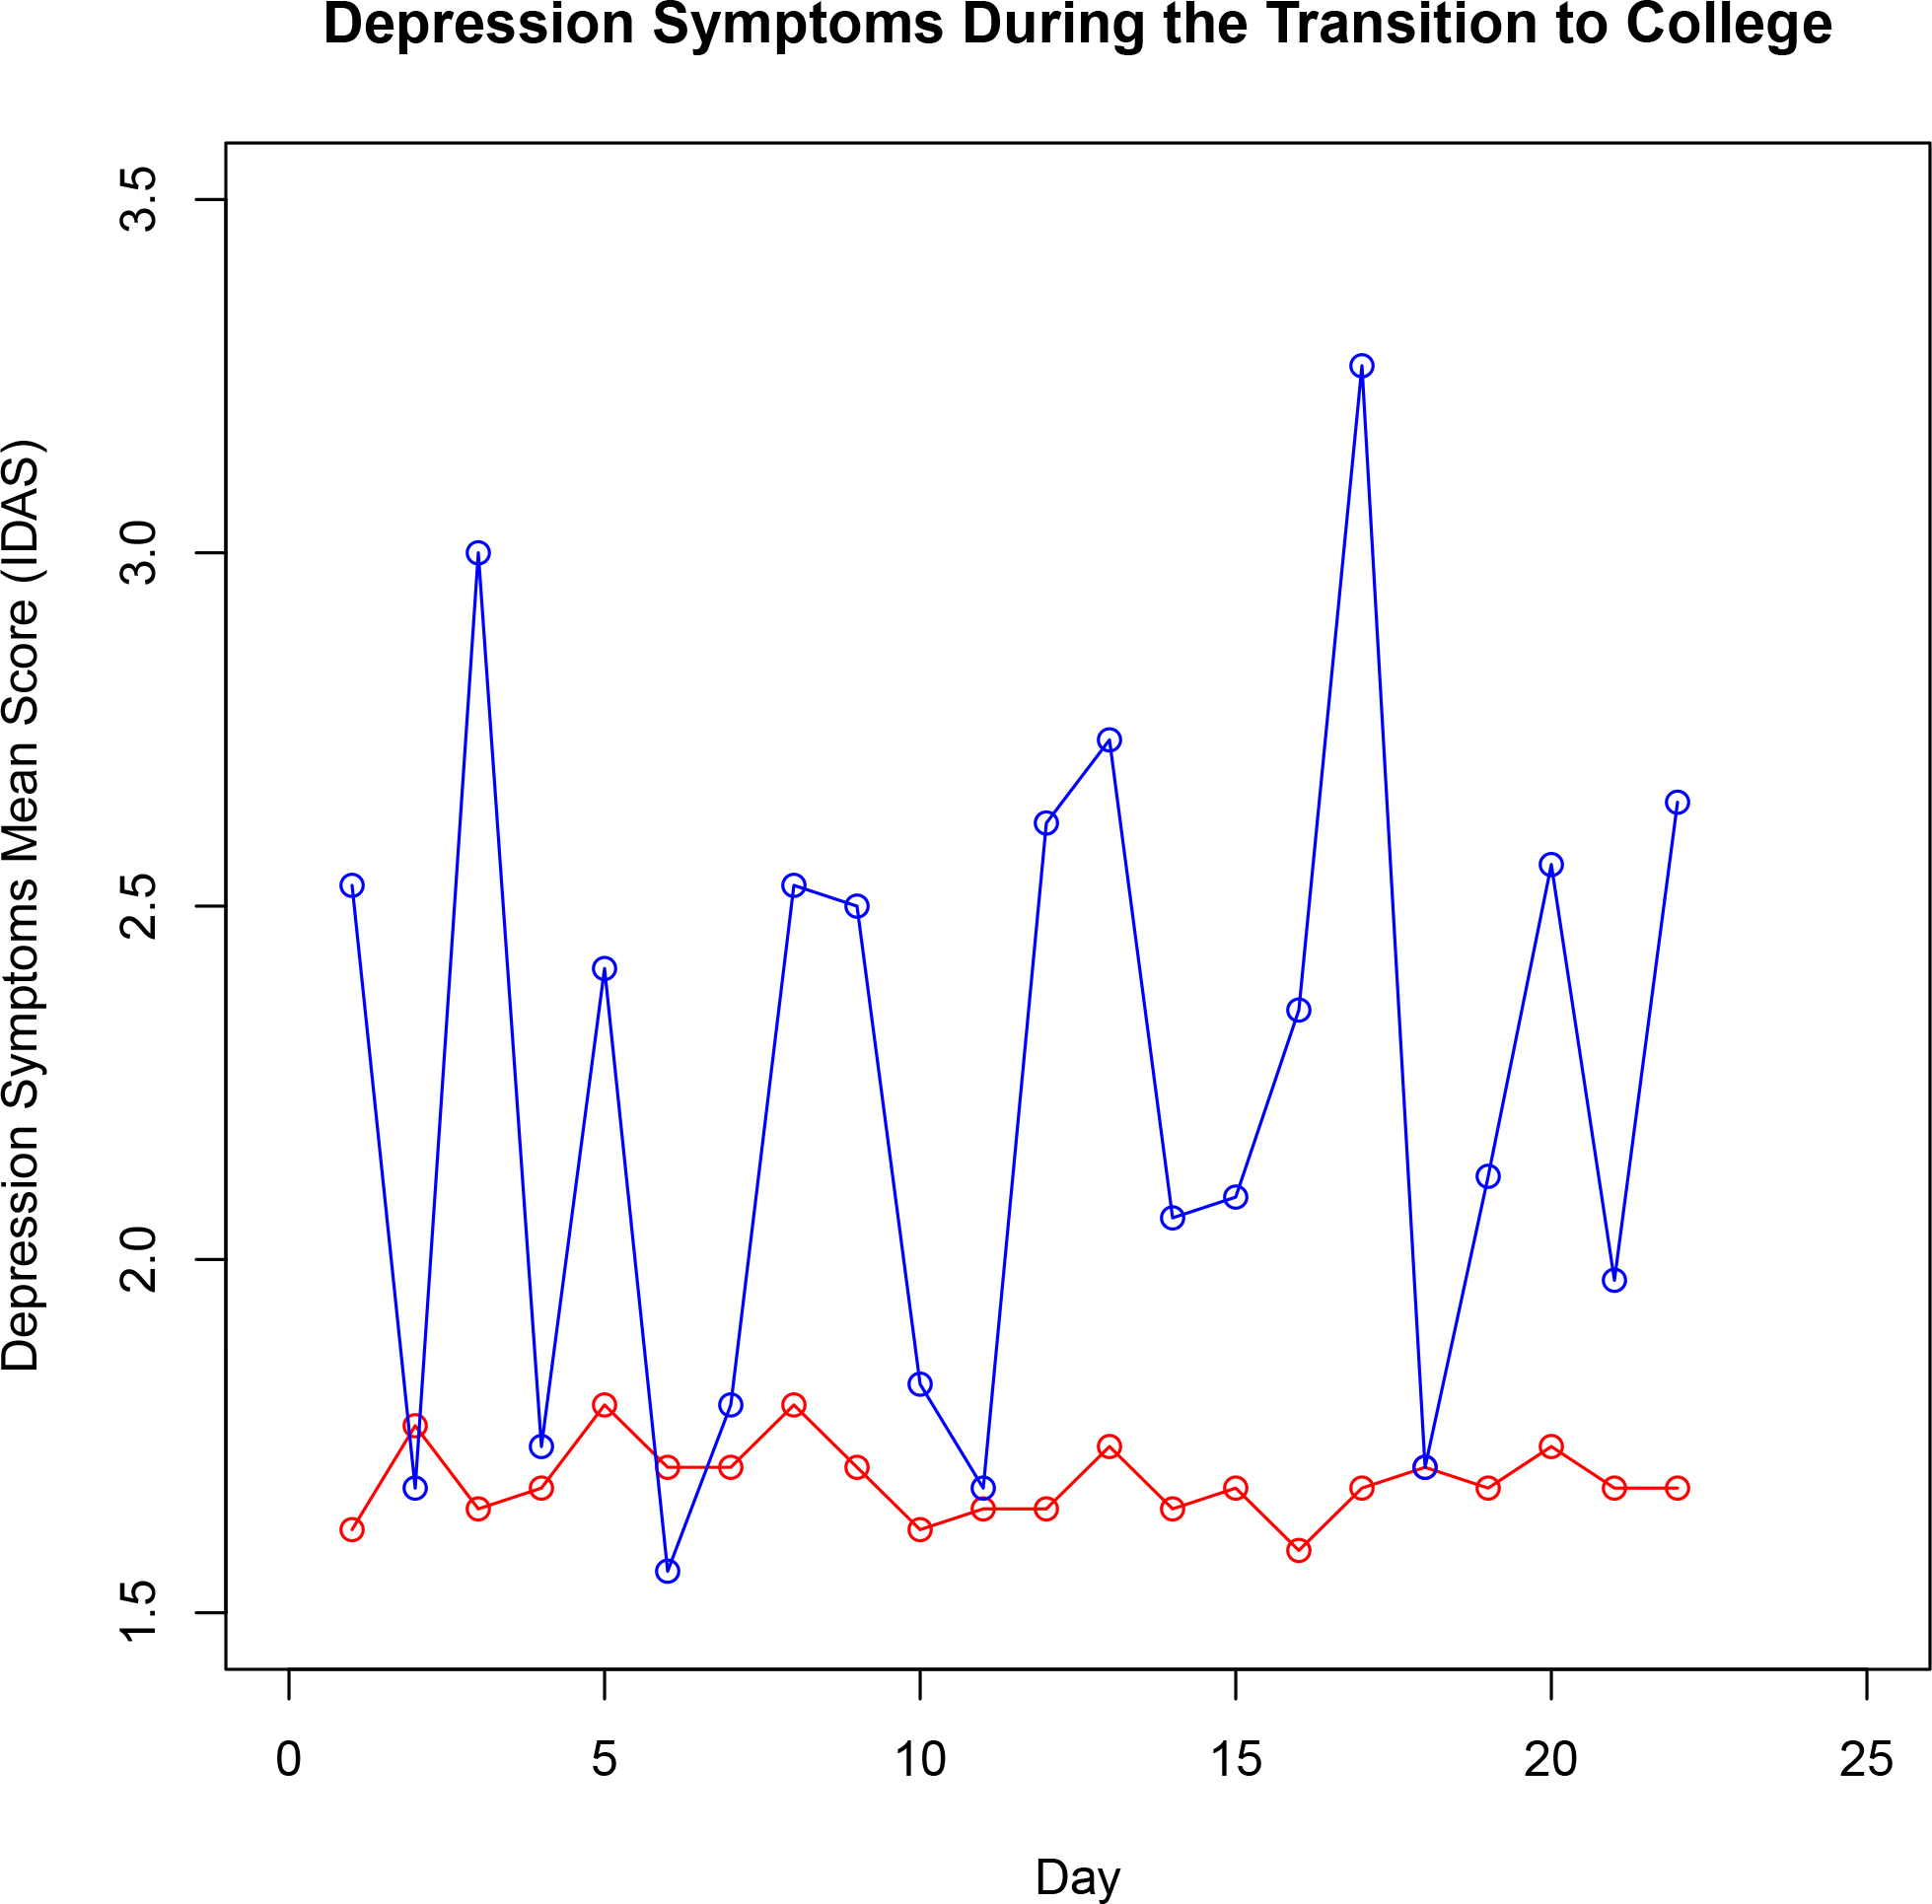
Figure 2. Individual Depression Symptom Trajectories.

The trajectories for the participant with the greatest variability (blue line) and the participant with the least variability (red line) in depression symptoms. Note: IDAS = Inventory of Depression and Anxiety Symptoms.
