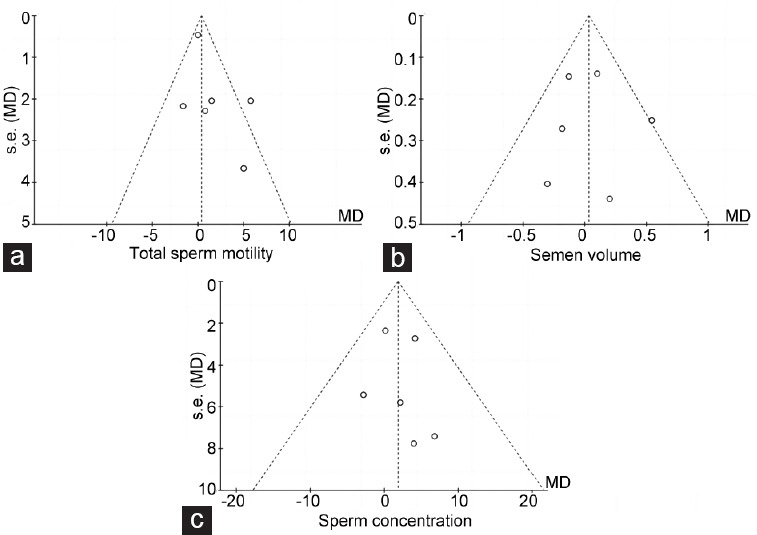
Figure 3.

Funnel plots of sperm parameter comparisons. There was no linear trend in all three funnel plots of data points, and all points are relatively symmetrically distributed at both sides of the combined effect line. No significant publication bias was detected in (a) total sperm motility, (b) semen volume, and (c) sperm concentration. MD: mean difference; s.e.: standard error.
