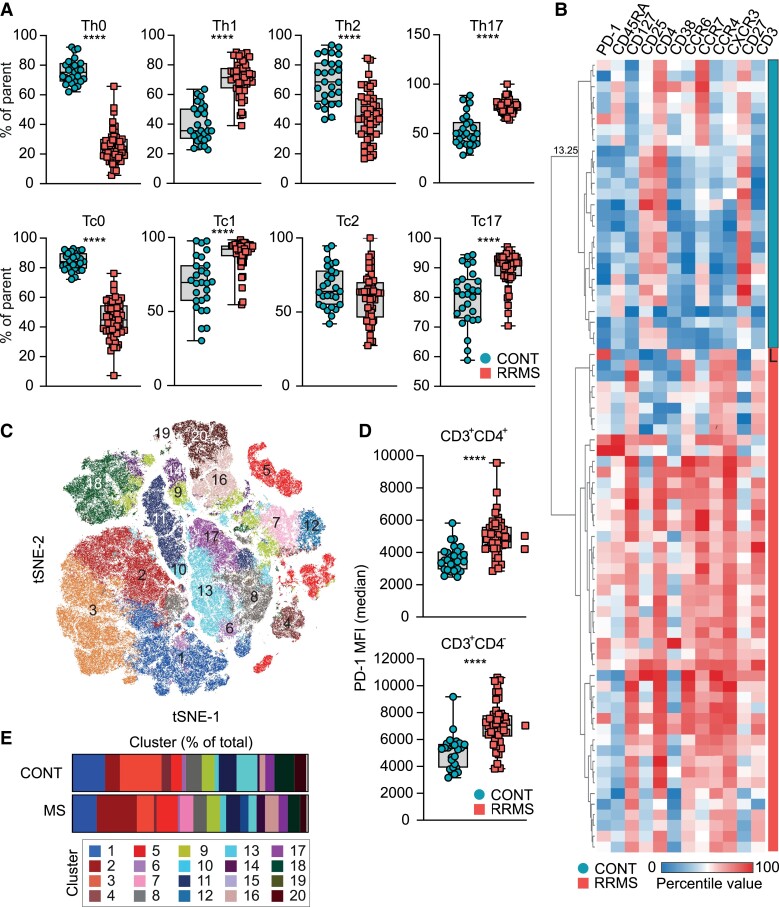
Figure 1.
Multiparametric immunophenotyping of peripheral T cells. (A) Frequencies of Th0 (CD3+CD4+CD45RA+CCR6-CCR4-CXCR3-), Th1 (CD3+CD4+CD45RA-CCR4-CCR6-CXCR3+), Th2 (CD3+CD4+CD45RA-CCR6-CCR4+CXCR3-) and Th17 (CD3+CD4+CD45RA-CCR6+CCR4+CXCR3+) cells in controls (CONT; n = 27) and MS (n = 49) patients. Unpaired two-tailed t-test with Welch’s correction; ****P < 0.0001. (B) Hierarchical clustering by Euclidean distance. Clustering was performed based on the expression of CD3, CD4, CXCR3, CD45RA, CD127, CCR7, CD25, CCR6, PD-1, CCR4, CD38 and CD27. Compared were MS (n = 49) patients and healthy control (CONT; n = 27). (C) Unsupervised tSNE clustering of healthy controls (CONT; n = 27) and MS (n = 49) patients followed by FlowSOM clustering (k = 20). (D) Median fluorescent intensity of PD-1 in CD3+CD4+and CD3+CD4− cells in healthy controls (CONT; n = 27) and MS (n = 49) patients. Unpaired two-tailed t-test with Welch’s correction; ****P < 0.0001. (E) Abundance of clusters identified by FlowSOM clustering in healthy controls (CONT; n = 27) and MS (n = 49) patients.

