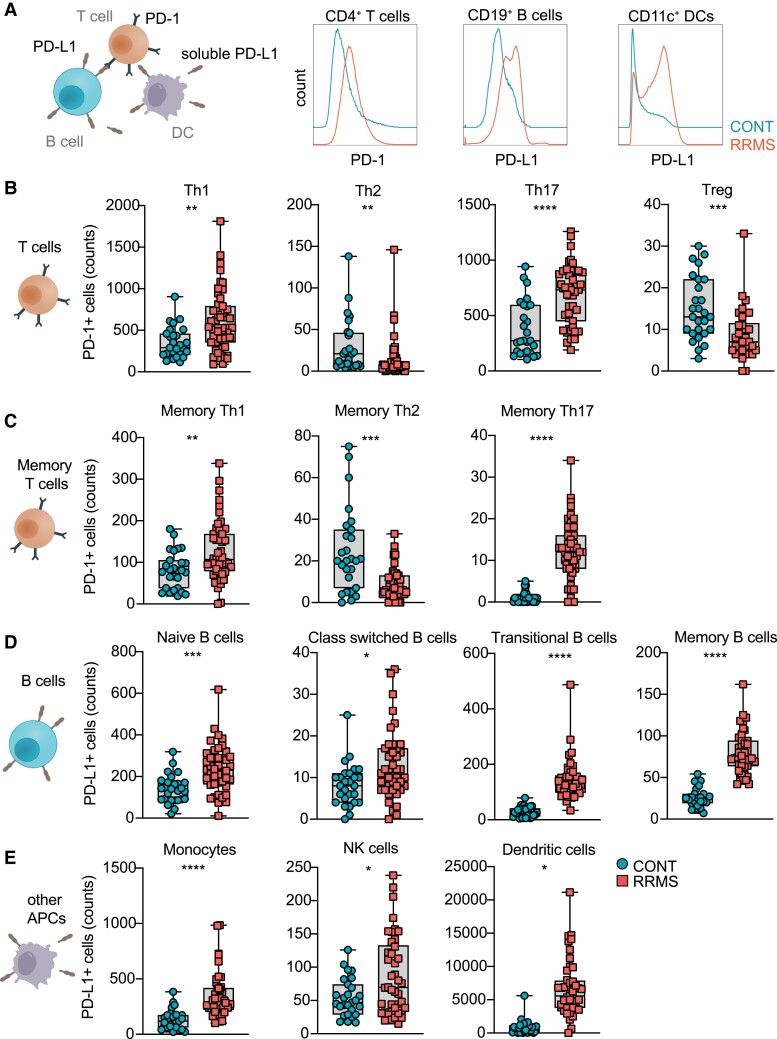
Figure 2.
Membranous PD-1 and PD-L1 expression on PBMCs. (A) Simplified model of PD-1 and PD-L1 interaction between T cells, B cells and APCs. (B) Counts of PD-1+ Th1, Th2 and Treg cells in controls (CONT; n = 27) and MS (n = 49) patients. Unpaired two-tailed t-test with Welch’s correction; **P < 0.01, ***P < 0.001 and ****P < 0.0001; Th, T helper cells; Treg, T regulatory cells. (C) Counts of PD-1+memory Th1, Th2 and Th17 cells in controls (CONT; n = 27) and MS (n = 49) patients. Unpaired two-tailed t-test with Welch’s correction; **P < 0.01, ***P < 0.001 and ****P < 0.0001; Th, T helper cells. (D) Counts of PD-L1+ B cells, class-switched B cells, transitional B cells and memory B cells in controls (CONT; n = 27) and MS (n = 49) patients. Unpaired two-tailed t-test with Welch’s correction; *P < 0.05, ***P < 0.001 and ****P < 0.0001. (E) Counts of PD-L1 + monocytes, NK cells and dendritic cells in controls (CONT; n = 27) and MS (n = 49) patients. Unpaired two-tailed t-test with Welch’s correction; *P < 0.05 and ****P < 0.0001; NK, natural killer cells.

