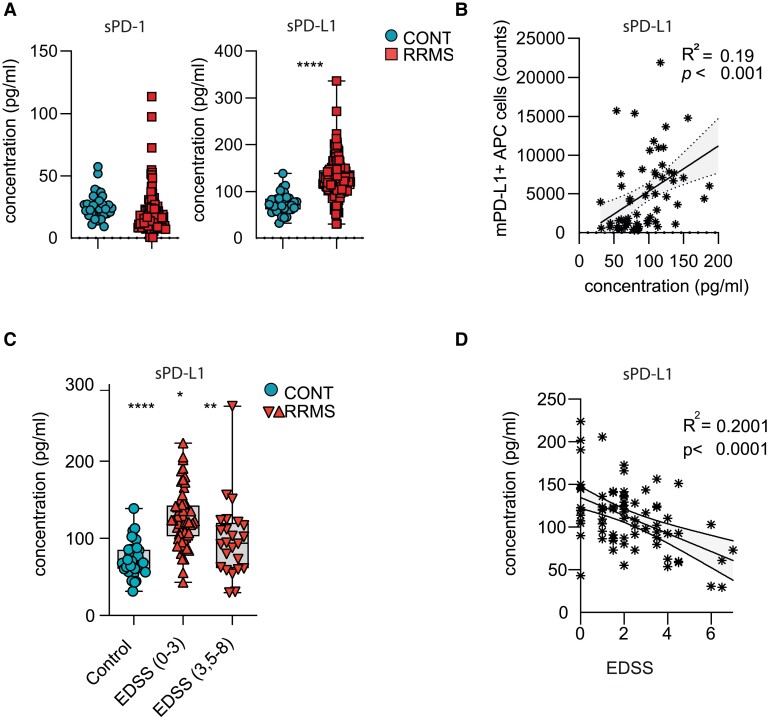
Figure 3.
Correlation of sPD-L1 concentration with disease severity in RRMS patients. (A) sPD-1 (left) and sPD-L1 (right) concentration was assessed in serum samples of patients with RRMS (n = 84) and controls (n = 36). Significance levels were determined by unpaired two-tailed t-test with Welch’s correction; ns, not significant; ****P < 0.0001. (B) Linear regression analysis of correlation between soluble PD-L1 concentration in serum and surface expression of PD-L1 (counts) on APCs (B cells, monocytes and dendritic cells) in the cohort where PBMCs and serum were in RRMS (with exclusion of IFN-β-treated patients; n = 41) and CONT (n = 27) patients available (also see Table 1 and Supplementary Tables 1 and 2). (C) sPD-L1 concentration was assessed in serum samples of patients with RRMS patients with exclusion of IFN-β-treated patients (n = 70) with different disability levels as determined by EDSS, where higher scores indicate increased disease severity. Significance levels were determined by unpaired two-tailed t-test with Welch’s correction; ***P < 0.001. (D) Linear regression analysis of correlation between sPD-L1 concentration and EDSS in RRMS patients with exclusion of IFN-β-treated patients (RRMS; n = 70). Numbers indicate R2 and P-value of linear regression analysis.

