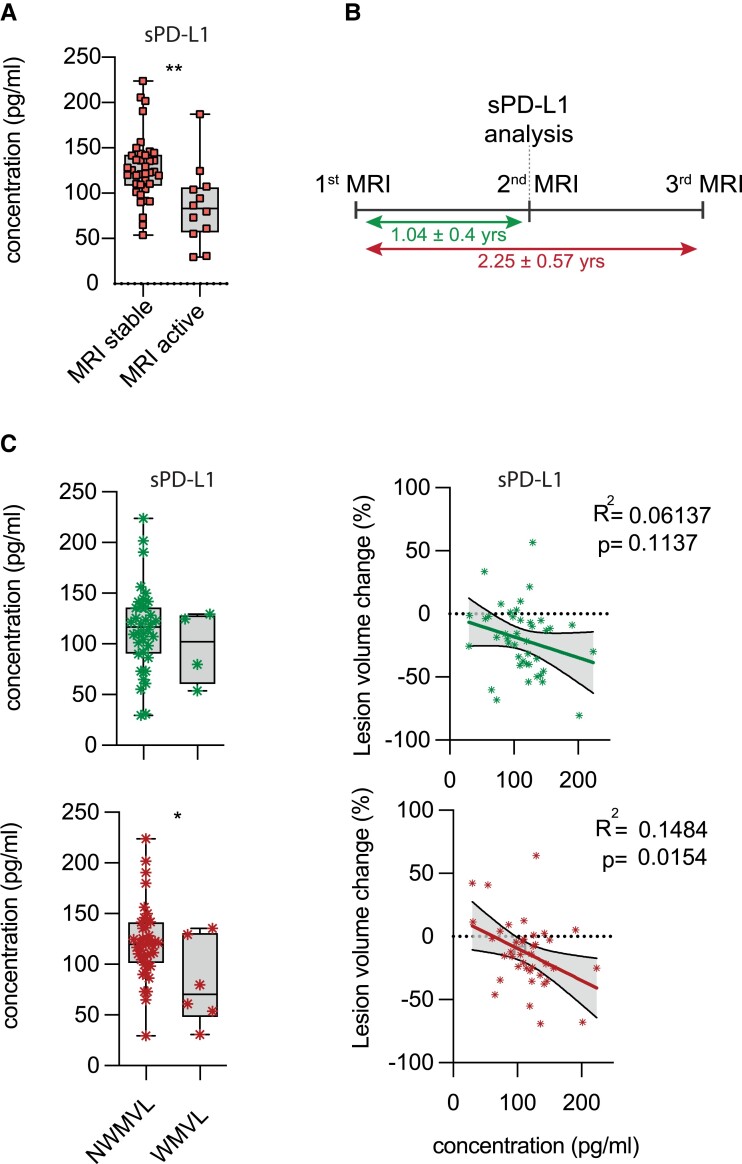
Figure 4.
Correlation of sPD-L1 concentration with MRI activity in RRMS patients. (A) sPD-L1 serum levels (pg/ml) in patients with stable versus active disease as determined by MRI (Tables 1 and 2 and Supplementary Tables 2 and 3). Stable MRI was defined as no new lesion or contrast-absorbing lesion since the last imaging, which occurred 1 year in advance of the blood sampling. Active MRI was defined as a new gadolinium-enhanced brain lesion and/or new T2 lesion at the time of blood sampling. Unpaired two-tailed t-test with Welch’s correction; *P < 0.05. (B) Timeline of MRI scans and blood sampling in the disease course of 40 RRMS patients used for the longitudinal assessment of sPD-L1 serum levels in respect to disease activity. (C) sPD-L1 serum levels in 40 RRMS patients with available MRI data 1 year (1.04 ± 0.4 years) before blood sampling, during blood sampling and 1 year after blood sampling were analysed. Lesion load volume change and white matter volume loss (WMVL) between first and second MRI (upper; 1.04 ± 0.4 years) as well as between first and third MRI (lower; 2.25 ± 0.57 years) were assessed and correlated to sPD-L1 levels analysed at the time of the second MRI. Numbers indicated R2 and P-value of linear regression analysis. For WMVL, significance levels were determined by unpaired two-tailed t-test with Welch’s correction; *P < 0.05.

