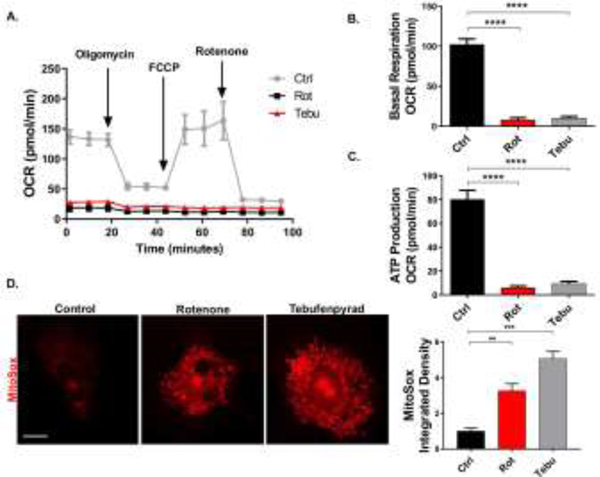
Figure 2: Rotenone (Rot) and tebufenpyrad (Tebu) alter mitochondrial dynamics and increase oxidative stress in enteric glial cells (EGCs).
EGCs treated with Rot and Tebu at 1 μM for 6 hrs in Seahorse Mito Stress assay show reduced (A) oxygen consumption rate, (B) basal respiration, and (C) ATP production. (D) MitoSox assay shows increased mitochondrial superoxide produced in the EGCs exposed to pesticides. Scale bar, 25 μm. Right: Quantification of the integrated density of MitoSox. Data analyzed via one-way ANOVA and represented as mean±SEM, **p <0.01, ***p<0.001, ****p<0.0001.

