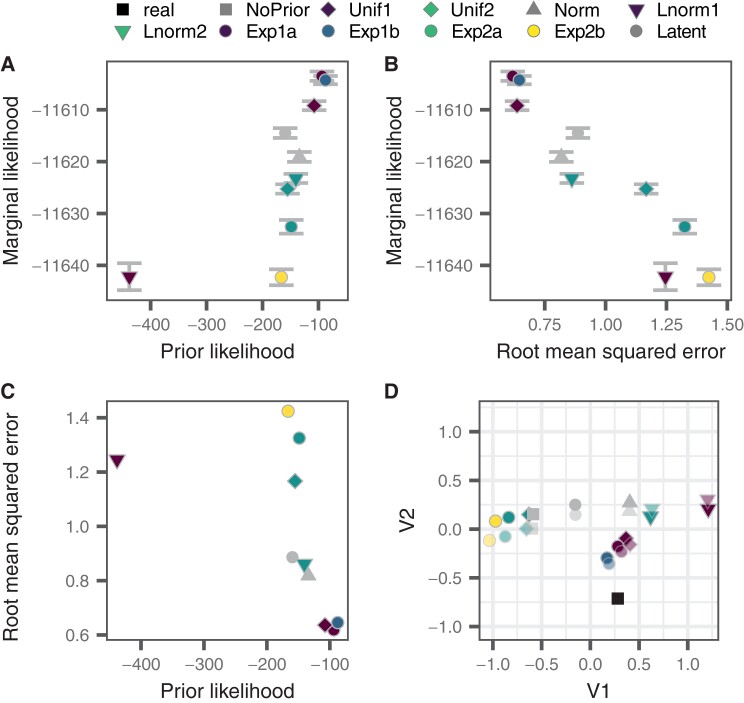
Fig. 5.
Comparison of marginal likelihood, prior likelihood, and RMSE of simulated data. (A) The likelihood of the real integration dates using a specific date prior (prior probability density) versus the marginal likelihood of the BEAST2 run using that date prior. Error bars show twice the range of the SD of the estimate of the marginal likelihood. (B) RMSE (in years) of the date estimation of a BEAST2 run using a specific prior versus the marginal likelihood using that date prior. Error bars show twice the range of the SD of the estimate of the marginal likelihood. (C) The likelihood of the real integration dates using a specified date prior (prior probability density) versus the RMSE (in years) of the date estimation of the BEAST2 run using that date prior. (D) Sammon MDS of the root mean squared deviation between the estimates using each prior and the actual (real) dates. Faded points correspond to estimates achieved without using a fixed-tree topology. Axes units for V1 and V2 are time in years.

