
Figure 3.
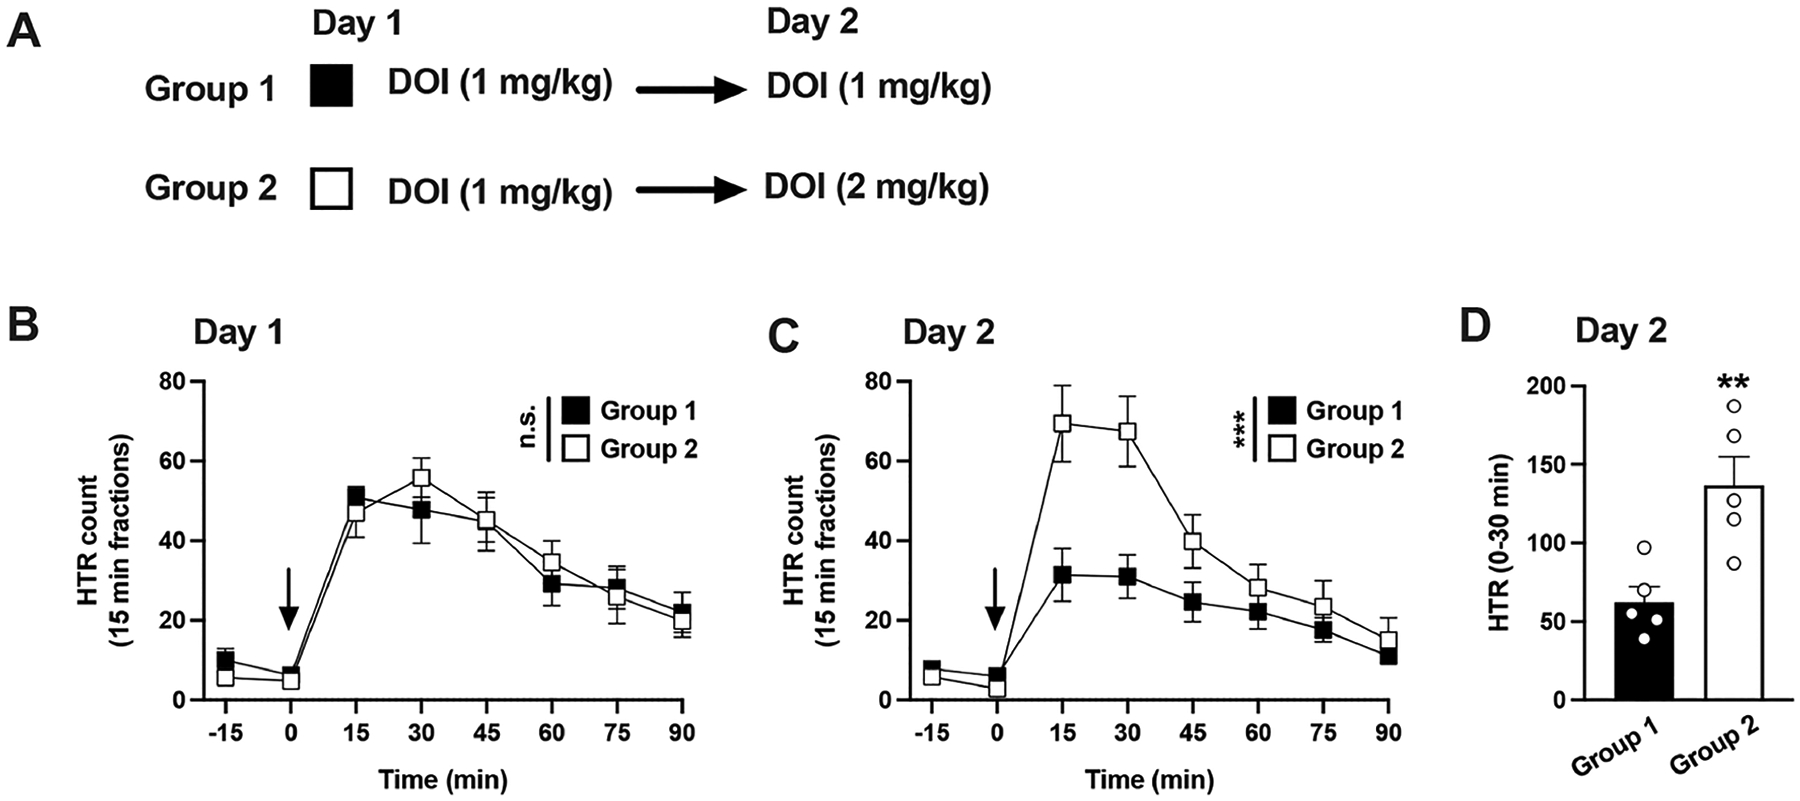
(A−D) Tolerance to HTR induced by DOI is surmountable by dose. Experimental design depicting the different treatment groups and days (n = 5 mice per group) (A). Time course of HTR on day 1 (B). Time course of HTR on day 2 (C). Total HTR during the first 30 min following DOI administration on day 2 (D). Student’s t test (D) and two-way repeated measures ANOVA (B,C) followed by Bonferroni’s posthoc test; **p < 0.01, ***p < 0.001, n.s., not significant. Arrows indicate time of injection (B,C). Data show mean ± standard error of the mean.