Fig. 5.
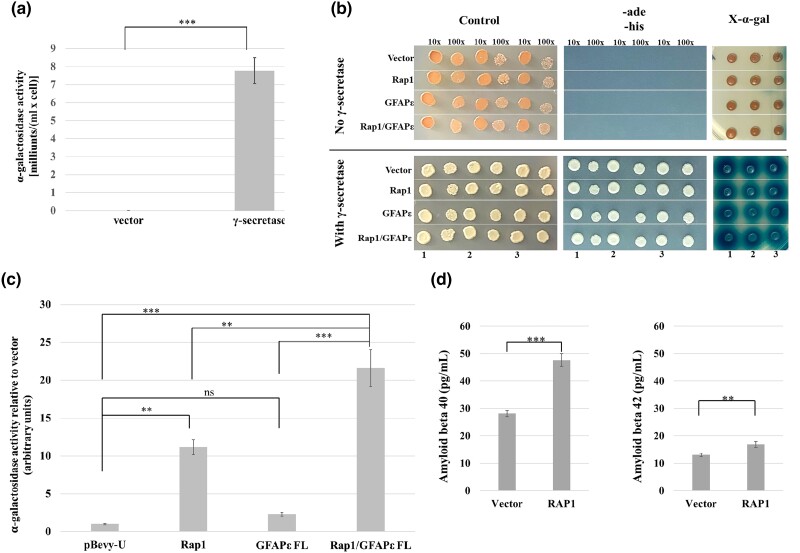
RAP1 and GFAPɛ affect the activity of human γ-secretase expressed in yeast. a) Strain MY14 (expressing C99-Gal4p) was transformed with pBEVY-T and pBEVY-L vectors or the pBEVY plasmids expressing the four subunits of the γ-secretase complex. Four independent transformants of each were grown for use in an α-galactosidase activity assay. The bars on the graph represent the average α-galactosidase activity with error bars representing the standard error of the mean. The P-value was determined using a one-tailed student's t-test (***P < 0.001). b) Strain MY14 (expressing C99-Gal4p) with pBEVY-T and pBEVY-L vectors or the pBEVY plasmids expressing the four subunits of the γ-secretase complex were transformed with the pBEVY-U vector, or pBEVY-U expressing RAP1, GFAPɛ, or both RAP1 and GFAPɛ. Three independent transformants of each were assayed. Cells were grown in SC-trp-leu-ura medium. Cells were spotted directly onto SC-trp-leu-ura medium with X-α-gal (panels on right) or diluted before plating the 1:10 and 1:100 dilutions on SC-trp-leu-ura (control) medium (left panels) or SC-trp-leu-ura-ade-his medium (center panels). The dilutions are indicated above the images, and the sample numbers are indicated at the bottom. c) Strain MY14 (expressing C99-Gal4p) with the pBEVY plasmids expressing the four subunits of γ-secretase were transformed with the pBEVY-U vector, or pBEVY-U expressing RAP1, GFAPɛ, or both RAP1 and GFAPɛ. Three independent transformants of each were used, and three technical replicates for each assayed for α-galactosidase activity. The technical replicate values were averaged to represent each of the biological replicates. The bars on the graph represent the average α-galactosidase activity of the biological replicates relative to the average activity of the control for simplicity. Error bars represent the standard error of the mean of the biological replicates. The P-values were determined using a nested, one-way ANOVA with a Tukey's multiple comparisons test (**P < 0.01; ***P < 0.001; ns, not significant). d) U251 cells were transfected with pLPC vector or pLPC-hRAP1 FL that overexpresses RAP1. Six wells transfected with each plasmid were used to measure Aβ40 and Aβ42. Two technical replicates for each were measured using ELISA. The bar graphs represent the average concentration of the peptides in the media. Error bars represent the standard error of the mean of the biological replicates. P-values were determined using a two-tailed student's t-test (**P < 0.01; ***P < 0.001).

