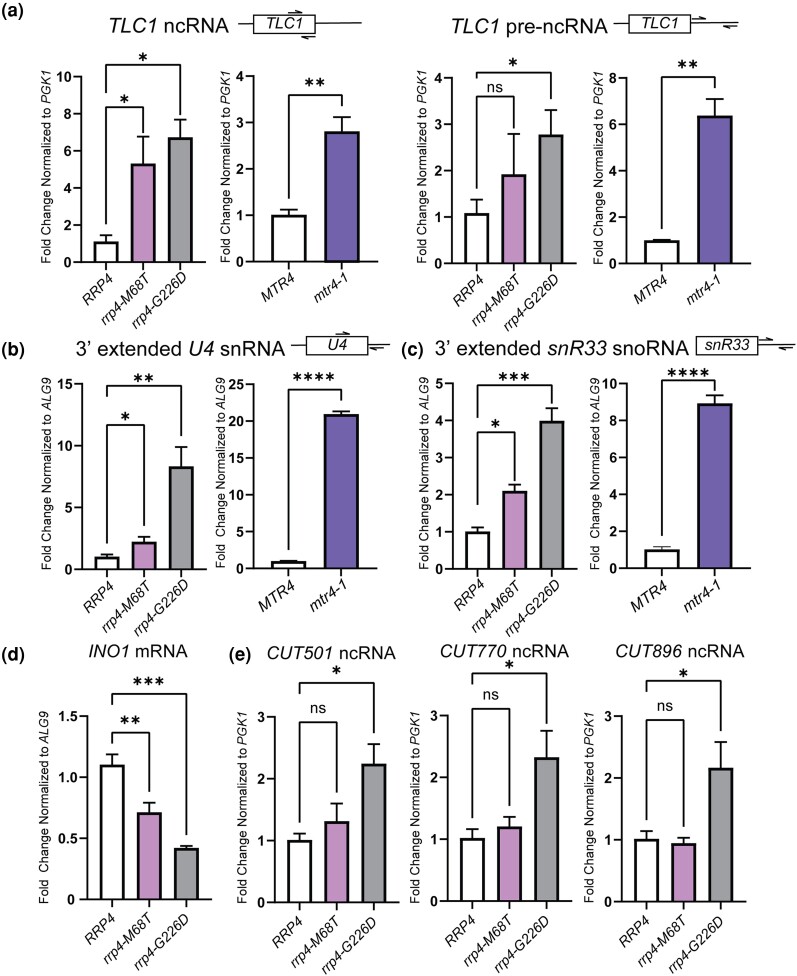
Fig. 4.
The rrp4-M68T mutant cells show elevated levels of specific RNA exosome target transcripts that depend on the Mtr4-RNA exosome interaction in vivo. The steady-state level of several RNA exosome target transcripts was assessed in rrp4-M68T cells (denoted in pink). The steady-state levels of these RNAs were also assessed in the previously described rrp4 variant rrp4-G226D as a control (denoted in gray). a) The rrp4-M68T cells show an elevated steady-state level of mature TLC1 telomerase component ncRNA relative to RRP4 cells. The steady-state level of the precursor TLC1 ncRNA in rrp4-M68T cells follows this upward trend though not statistically significant compared to RRP4 cells. This increase in both mature and precursor TLC1 is also observed in mtr4-1 (denoted in purple) compared to the wild-type control MTR4. b) The rrp4-M68T cells show an elevated steady-state level of 3′-extended pre-U4 snRNA relative to RRP4 cells. The rrp4-G226D mutant cells and mtr4-1 cells have even higher steady-state levels of this pre-U4 snRNA when compared to the RRP4 and MTR4 controls, respectively. c) The rrp4-M68T cells show an elevated steady-state level of 3′ extended snR33 snoRNA relative to RRP4 cells that is similar to the increase observed in the rrp4-G226D mutant cells and mtr4-1 cells. d) The rrp4-M68T cells show a decreased steady-state level of the mRNA transcript INO1 compared to wild-type RRP4 control cells. A decrease in this mRNA was shown previously in rrp4-G226D cells (Sterrett et al. 2021). e) The steady-state levels of non-coding, CUTs, CUT501, CUT770, and CUT896, are not significantly increased in rrp4-M68T cells compared to control as shown previously in the rrp4-G226D mutant cells (Sterrett et al. 2021). In a–e), total RNA was isolated from cells grown at 37°C and transcript levels were measured by RT-qPCR using gene-specific primers and graphed as described in Materials and Methods. Gene-specific primer sequences are summarized in Supplementary Table 2. The location of primers specific to the ncRNA transcripts are graphically represented by the cartoons above each bar graph. Within the cartoon transcript, the box represents the body of the mature transcript. Error bars represent standard error of the mean from three biological replicates. Statistical significance of the RNA levels in rrp4 variant cells relative to RRP4 cells and in the mtr4-1 cells relative to MTR4 cells is denoted by an asterisk (*P-value ≤ 0.05, **P-value ≤ 0.01, ***P-value ≤ 0.001, and ****P-value ≤ 0.0001).

