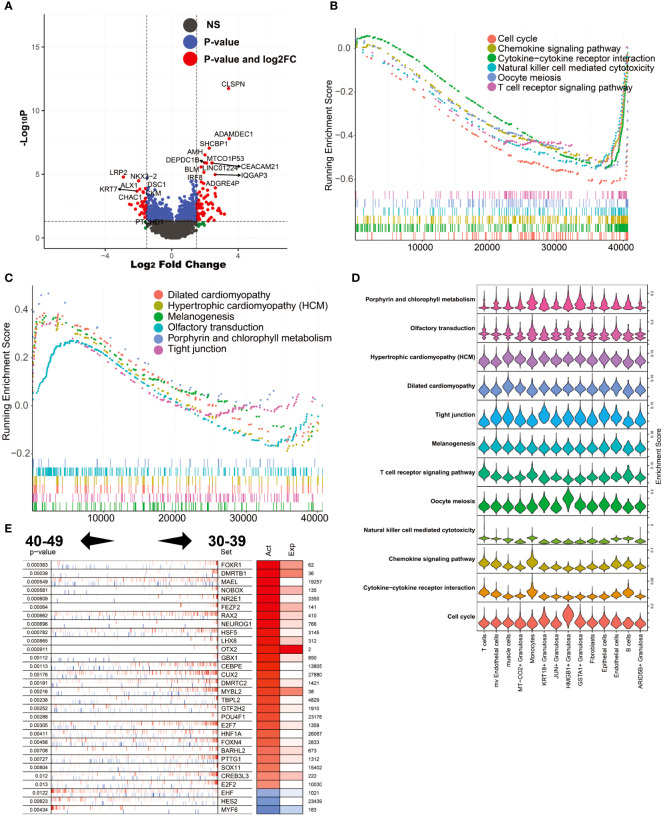
Figure 5.
Analysis of differentially expressed genes and master regulators of 40-49 vs. 30-39. (A) Volcano plot of differentially expressed genes. (B) GSEA analysis (log2FC ranking), signaling pathways enriched in the 30-39 age group. (C) GSEA analysis, signaling pathways enriched in the 40-49 age group. (D) Mapping of signaling pathways enriched in the two subgroups to single-cell sequencing data. (E) Results of master regulator analysis.

