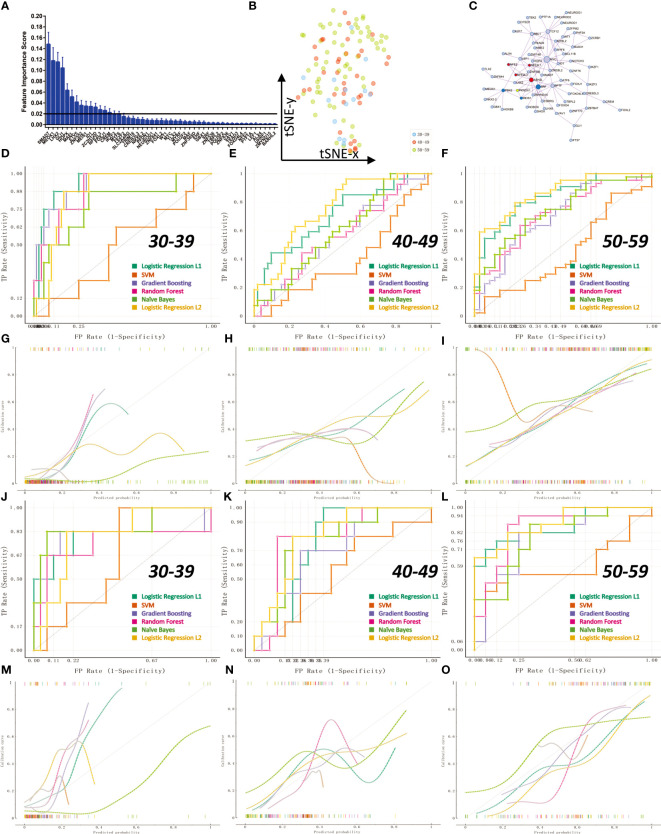
Figure 7.
Transcription factor activity for diagnosis of ovarian status in pre- and post-menopausal women. The 112 samples were divided into training set and validation set according to the 70% cutoff point. (A) Through 1000 times of Logistic Regression L1, 16 transcription factors with an average feature weight higher than 0.2 were screened. (B) Non-linear dimensionality reduction (t-SNE algorithm) of 112 ovarian samples using 16 transcription factors. (C) PPI network regulation map of 105 transcription factors with average weights other than 0. There are two core regulation modules (MCODE algorithm), the red module is composed of NFE2, NFE2L1, NFE2L3, ASH2L; the blue module is composed of PBX2, SRF, MEIS1. (D, G) ROC curve and calibration curve of training set 10-fold cross-validation at age 30-39. (E, H) ROC curve and calibration curve of 10-fold cross-validation in the training set at age 40-49. (F, I) ROC curve and calibration curve of training set 10-fold cross-validation at age 50-59. (J, M) ROC curve and calibration curve of the validation set at age 30-39. (K, N) ROC curves and calibration curves of the validation set at age 40-49. (L, O) ROC curves and calibration curves of the validation set at age 50-59.

