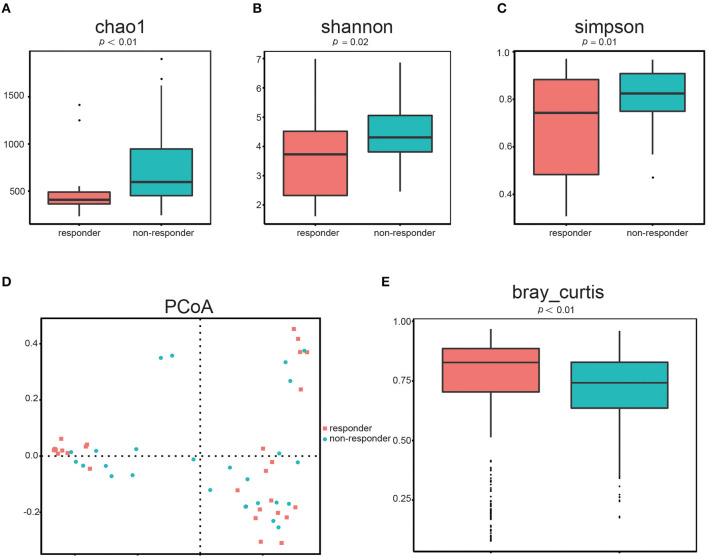
Figure 1.
Gut microbial diversity in responders (n = 26) and non-responders (n = 28). α-diversity was evaluated based on the Chao1 (A), Shannon (B), and Simpson (C) indices of the OTU levels. Principal coordinate analysis of β-diversity was based on the PCoA (D) and Bray–Curtis (E) analyses of the OTU levels.

