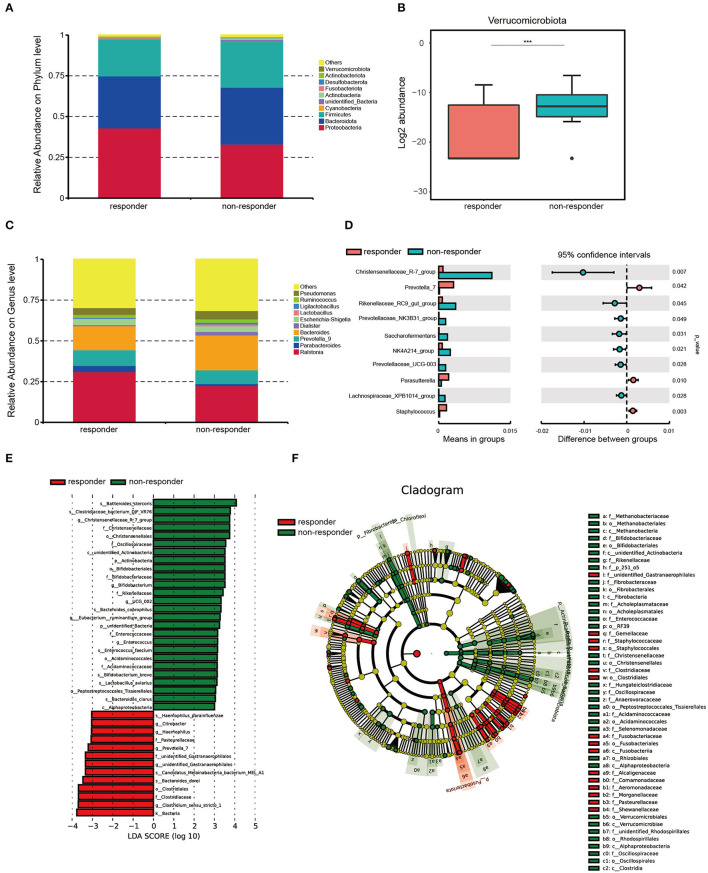
Figure 2.
Microbiota composition in responders (n = 26) and non-responders (n = 28). (A) Summary of the relative abundances of phyla present in the study population. (B) Log2 abundance of Verrucomicrobiota. Verrucomicrobiota were significantly elevated in non-responders compared with responders. Statistically significant differences according to the MetaStat are marked with asterisks. ***p < 0.001, **p < 0.01, and *p < 0.05. (C) Summary of the relative abundances of bacterial genera detected in responders and non-responders. (D) Genus-level bacteria that were significantly different between the responders and non-responders. Statistical analysis was performed by the t-test. (E) Histogram of LDA scores to identify differential abundant bacteria between responders and non-responders (LDA score > 3). (F) Cladogram generated from the LEfSe analysis indicating the phylogenetic distribution from class to species of the gut microbiota of responders and non-responders.

