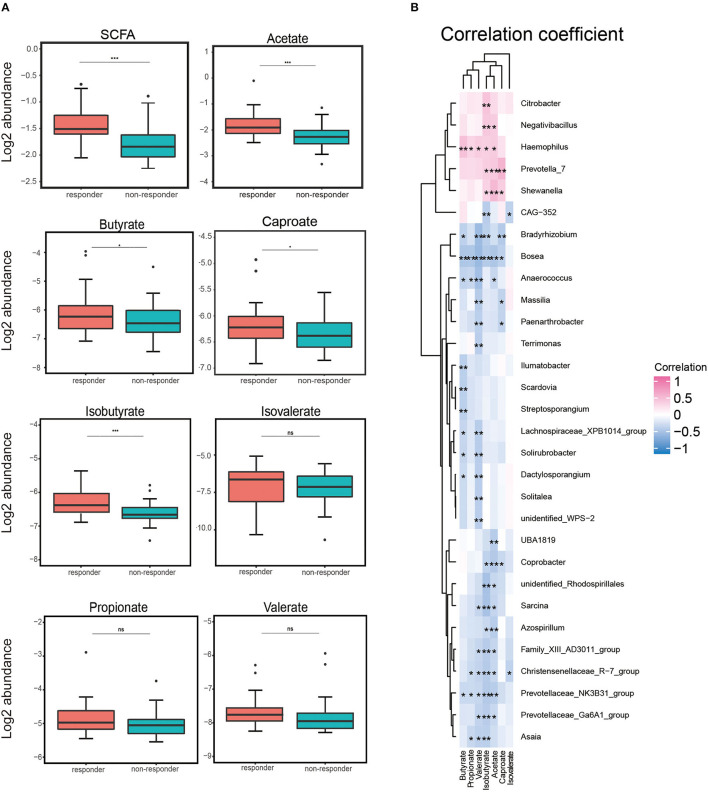
Figure 3.
Log2 abundance of short-chain fatty acids (SCFAs) and Spearman's analysis between gut microbiota and SCFA. (A) Log2 abundance of total SCFA and acetate, butyrate, caproate, isobutyrate, isovalerate, propionate, and valerate separately. Log2 abundance of acetate and isobutyrate was found to be reduced significantly in non-responders (n = 30) compared with responders (n = 30). P-values from the t-test are shown. ***p < 0.001, **p < 0.01, and *p < 0.05. (B) Spearman's correlation analysis between the gut bacteria genus and serum SCFA. Positive and negative correlations are shown as pink and blue in the heat map, respectively. Significant microbiota–metabolite correlations were determined based on an | r | ≥ 0.8 and p < 0.05 (*p < 0.05).

