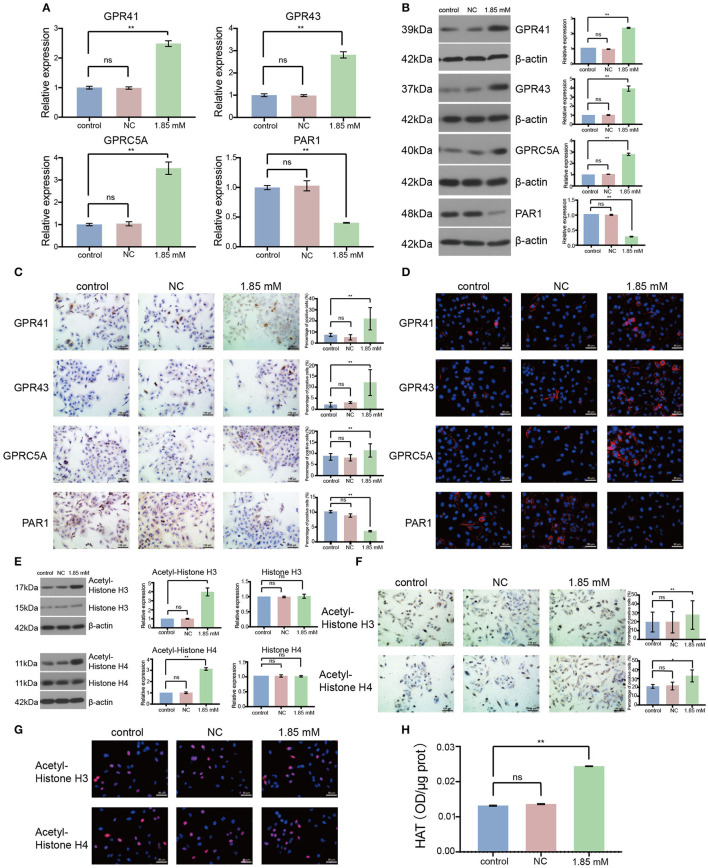
Figure 5.
Isobutyric acid regulated G protein-coupled receptor (GPCR) expression and histone acetyltransferase (HAT) activity. For the expression of GPCRs, the results of RT-qPCR (A), Western blot (B), and immunocytochemical staining (C) showed that GPR41, GPR43, and GPRC5A expressions were significantly higher, while PAR1 expression was significantly lower in isobutyric acid treatment group (1.85 mM) than the control groups (control and NC). Immunofluorescence staining (D) identified the expression location of GPCRs. For the expression of acetyl-histones and histones, the results of Western blot (E) and immunocytochemical staining (F) showed that acetyl-histone H3 and H4 expressions were significantly higher in the isobutyric acid treatment group (1.85 mM) than the control groups (control and NC), whereas Western blot results showed that there was no significant difference of the expression of histone H3 and H4 between isobutyric acid treatment group and the control groups. Immunofluorescence staining (G) identified the expression location of acetyl-histone H3 and H4. HAT activity assay (H) results showed that HAT activity was increased in the isobutyric acid treatment group (1.85 mM) than in the control groups (control and NC). P-values were calculated using Student's t-tests. ns: no significance; *p < 0.05; **p < 0.01; ***p < 0.001. All experiments were repeated three times. NC, negative control (0 mM).

