Figure 1:
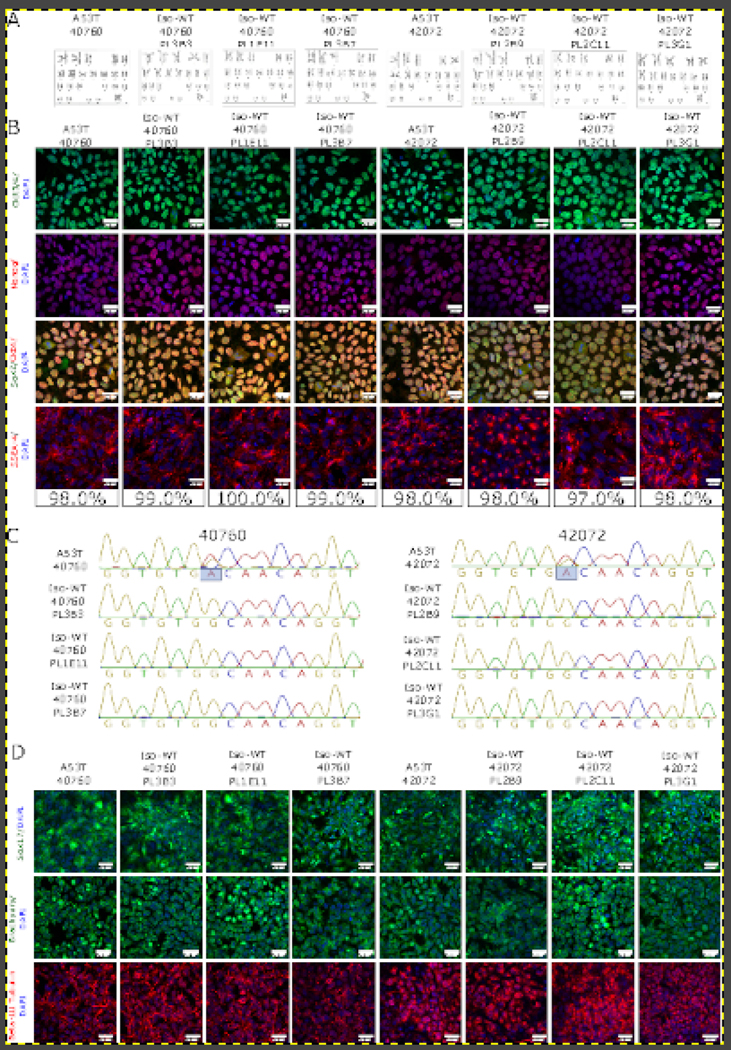
Generation of SNCA A53T isogenic controls. (A) Karyotype analysis of iPS unedited lines and isogenic clones (WT = wild type, clone ID above each corresponding graph). (B) Pluripotency analysis of selected lines. Top panel - OCT 3/4 (green), second panel - NANOG (red), third panel - Sox2 (green) and Oct4 (red), and fourth panel - SSEA-4 (red). The latter allowed for quantitative percentage estimation of pluripotent cells. All lines were counterstained with nuclear stain DAPI (blue). Scale bars = 20 μm. (C) Sequencing chromatograms of SNCA A53T lines and isogenic clones. (D) ICC analysis of differentiation potential. Endodermal layer (top panel SOX17, green); mesodermal layer (second panel, Brachuyry, green) and ectodermal layer (third panel, β-III Tubulin, red). All cells were counterstained with the nuclear dye DAPI (blue) and scale bars = 20 μm.

