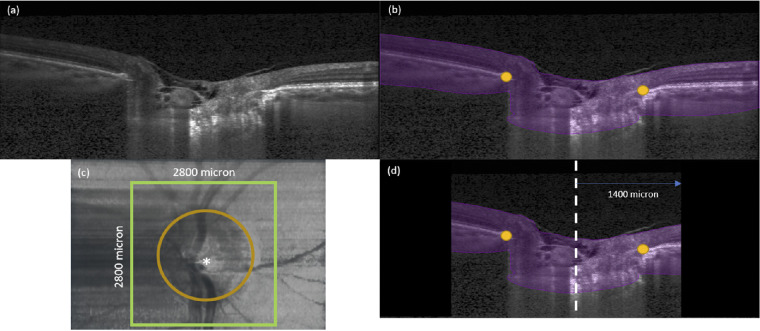
Figure 1.
(a) A single B-scan obtained from the OCT machine without any image enhancement. (b) Automatic segmentation of the B-scan in (a). ONH tissues were segmented in purple. In addition, BMOs (orange dots) were automatically marked for each B-scan. (c) Anterior-surface view of the ONH. The ONH center (white star) was identified from the best-fit circle to the BMOs (orange dotted line). The green square defines our region of interest to be cropped from the OCT volume with 2800 µm length on each side. (d) A B-scan view after we apply cropping to the OCT volumes. The black region was not considered for our deformation tracking. The length from central line (white dotted line) to the cropping border (green line) is 1400 µm.

