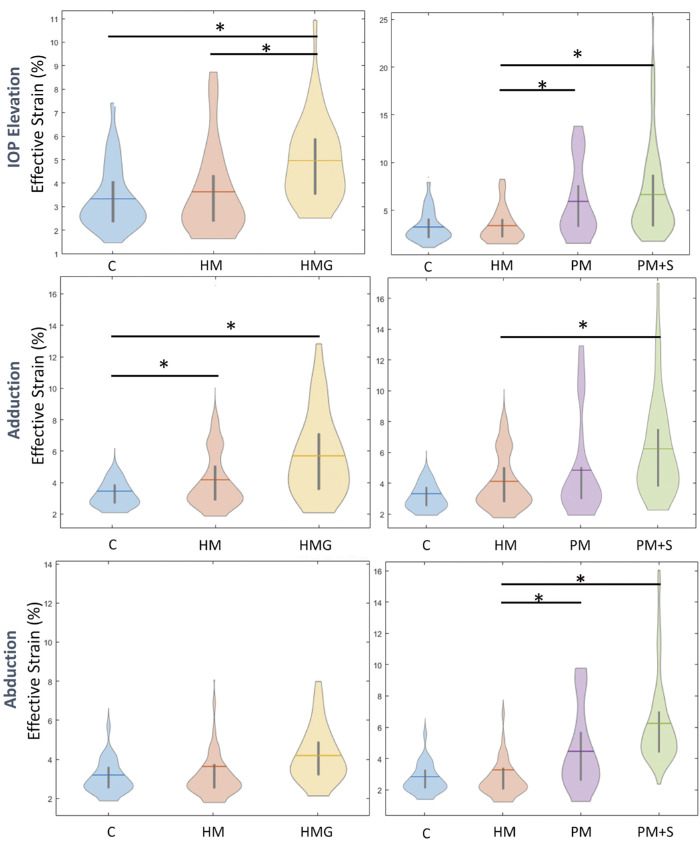
Figure 3.
Violin-plot showing average ONH effective strains for each group under IOP elevation, Adduction and abduction. The left column represents a comparison between HM and HMG and the right column represents a comparison across the myopia spectrum. * Denotes significant differences between the two groups.

