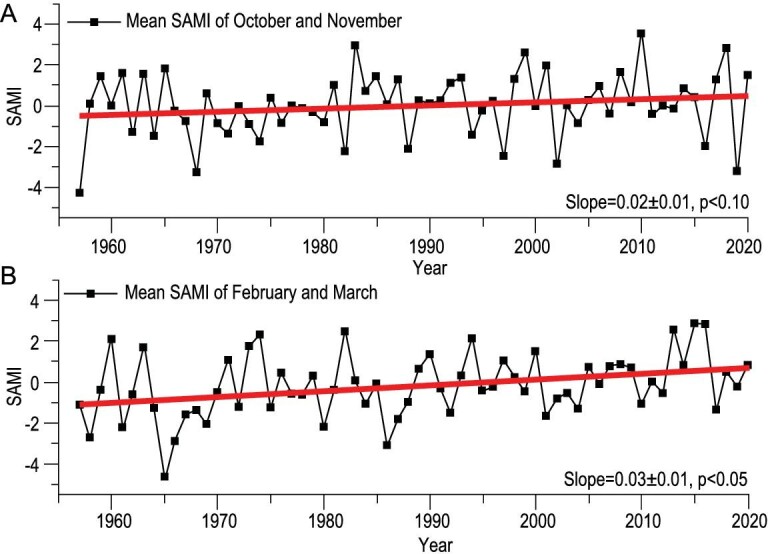
Figure 3.

Interannual variation of SAM index (SAMI) (1957.1–2020.12 obtained from https://legacy.bas.ac.uk/met/gjma/sam.html). (A) Melt onset (October and November) and (B) end date (February and March) with trend lines fitted for 1957–2020 (red line). The estimated slopes and its 95% confidence intervals are shown.
