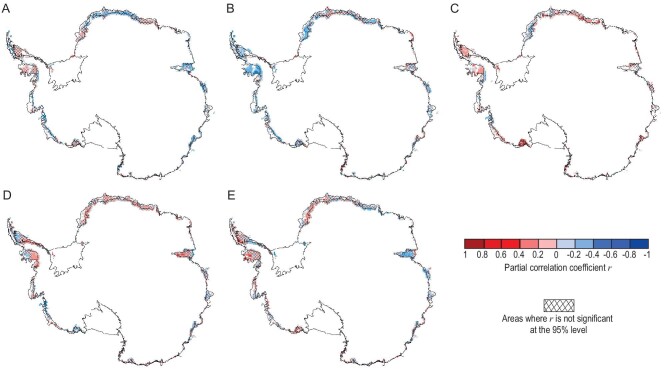
Figure 4.
Correlation between melt timing and SAM, SIC and turbulent heat flux. Spatial distribution of partial correlation coefficients between melt end date and (A) SAM, (B) SIC and (C) turbulent heat flux. Spatial distribution of partial correlation coefficients between melt onset date and (D) SAM and (E) SIC. The continent and oceans around Antarctica are divided into five regions (see Fig. 1A), then, for each region, we calculate the partial correlation coefficients between melt dates over continent and regional-averaged SIC, regional-averaged turbulent fluxes over sea. Hatching shows individual grid cells where the trend was not significant at the 95% level. The correlation analysis is performed on detrended data.

