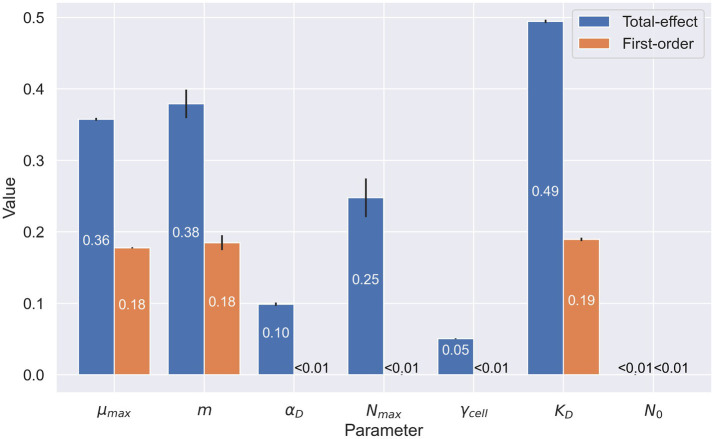
Figure 4.
Sensitivity analysis of microbial parameters used in the organic carbon model. Numerical values represent the first-order (in orange) and total-effect (in blue) Sobol indices of the selected parameters: maximum growth rate ( ), cell-specific metabolic rate ( ), cell carbon content ( ), carrying capacity ( ), cell specific extracellular enzyme activity ( ), half-velocity constant for carbon uptake ( ), and starting cell density ( ). First-order indices show the sensitivity of the model when varying only the parameter in question. Total-effect indices show the sensitivity of the model when varying the selected parameter in conjunction with the other parameters selected in this analysis. Values shown are rounded at 10−2.

