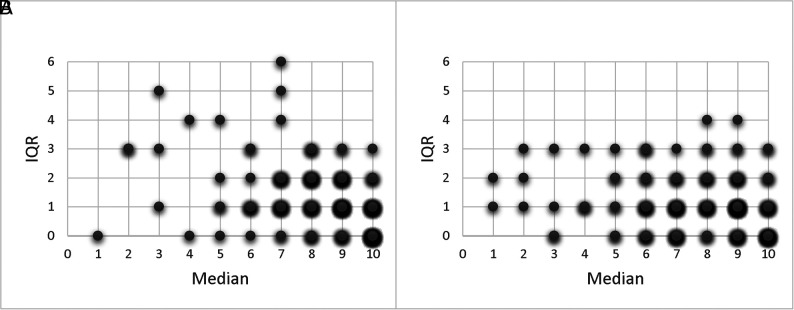
FIG 2.
Score distribution plots illustrating the improvement of the interrater agreement of the 5 raters without (A) and with (B) CAD. The intraclass correlation coefficient of the raters was 0.55 (95% CI, 0.48–0.62) without CAD compared with 0.73 (95% CI, 0.68–0.78) with CAD. IQR indicates interquartile range.

