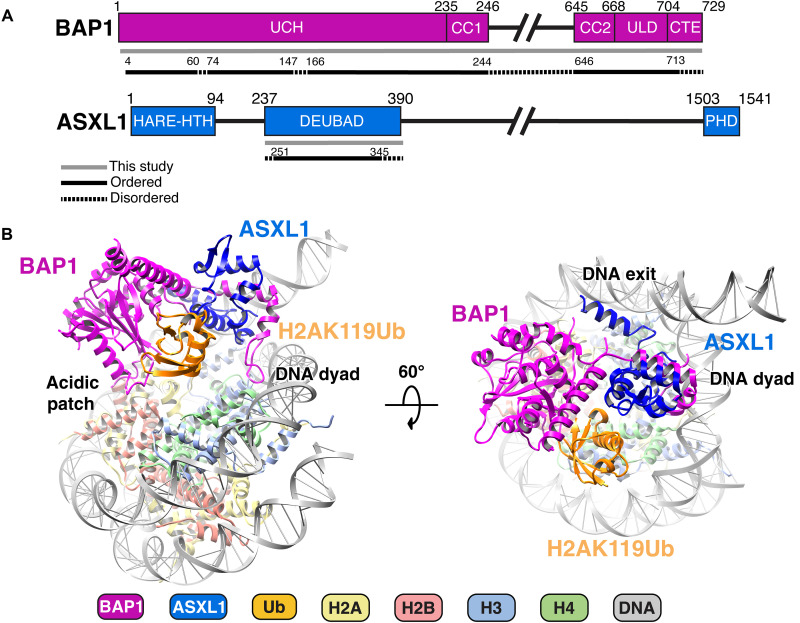
Fig. 1. Overview of the structure of BAP1/ASXL1 bound to H2AK119Ub nucleosome.
(A) Bar diagram representation of BAP1 and ASXL1 domains. Protein sequences included in this study are in gray line; those resolved in the structure are in black line; and disordered regions are in dashed line. (B) Two different views of the model for the BAP1/ASXL1-H2AK119Ub nucleosome complex with key anchor points highlighted. The figure is color-coded, depicting BAP1 (purple), ASXL1 (dark blue), Ub (orange), H2A (yellow), H2B (salmon), H3 (light blue), H4 (green), and DNA (gray).

