Figure 4.
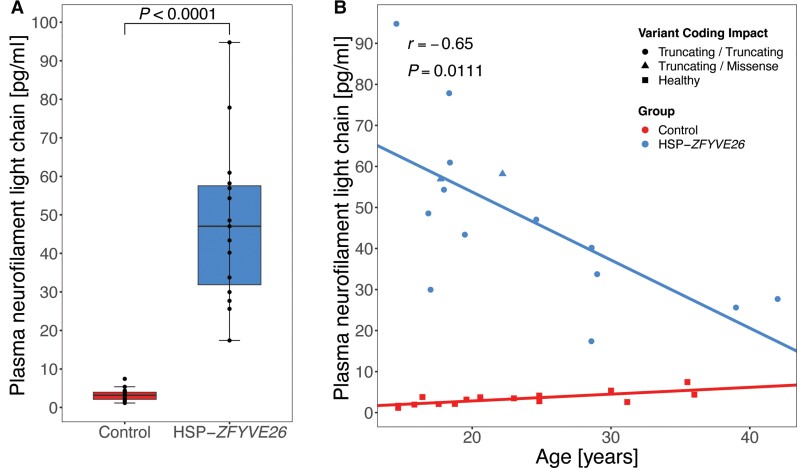
Plasma NfL levels are elevated in HSP-ZFYVE26. Plasma NfL levels were measured in 15 HSP-ZFYVE26 patients and mostly age- and sex-matched controls. (A) Absolute NfL levels show a robust separation of patients and controls (Mann–Whitney U-test, P < 0.0001). (B) Linear model of NfL levels across the age spectrum of the cohort. Variant coding impacts are coded by shape; circles indicate individuals with bi-allelic truncating variants, triangles represent individuals with one truncating variant in trans with a missense variant and squares illustrate healthy controls. Correlation analysis was performed using Spearman’s rank correlation coefficient.

