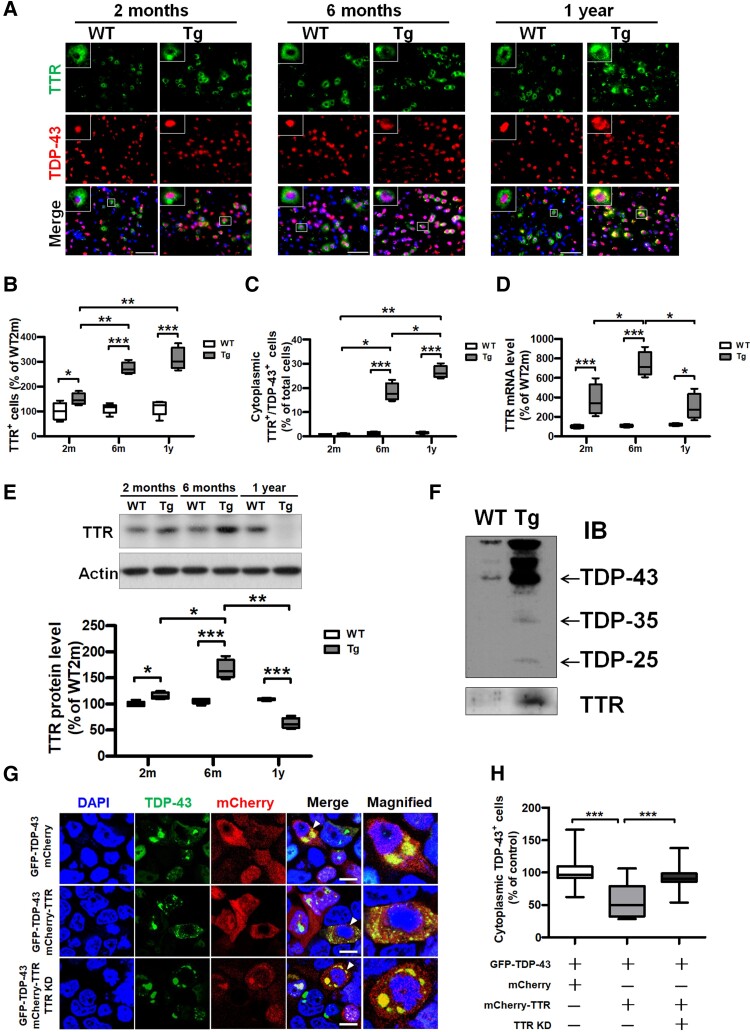
Figure 2.
Dysregulated TTR mislocalizes in TDP-43 inclusions in vivo and in vitro, wherein functional TTR expression facilitates the removal of cytoplasmic TDP-43 aggregates in vitro. (A) IF staining of TDP-43 (red) and TTR (green) in the brain tissue specimens from WT mice as well as TDP-43 Tg mice with age. Nuclei were counterstained with DAPI (blue). The enlarged images shown in the upper left are indicated with a white square line representing the co-occurrence of TDP-43 and TTR. Scale bar = 100 μm. (B) The number of TTR-immunoreactive cells and (C) TDP-43- and TTR double immunoreactive cells was quantified from the brain tissue specimens of WT mice and TDP-43 Tg mice at 2 and 6 months and 1 year old. (TTR+ cells: P < 0.0001, TDP-43+/TTR+ cells: P < 0.0001; repeated measures ANOVA with Bonferroni post hoc test) n = 8 sections per mouse; n = 5 mice per group. (D) Total RNA extracted from the forebrain tissues of WT mice and TDP-43 Tg mice at the indicated age were applied to calculate the mRNA level of TTR (P < 0.0001; repeated measures ANOVA with Bonferroni post hoc test). (E) The brain tissue lysates from WT and TDP-43 Tg mice extracted from detergent-soluble fractions at the indicated age were used to analyse the protein levels of TTR (P < 0.0001; repeated measures ANOVA with Bonferroni post hoc test). (F) Western blot analysis of TDP-43 and TTR in insoluble fractions from WT and TDP-43 Tg mice at 6 months. (G) HEK293 cells were overexpressed with TDP-43-GFP and administered with MG132, respectively combined with mCherry only, mCherry-TTR or mCherry-TTR overexpression along with TTR knockdown (TTR KD), which represent with confocal images. The magnified view is shown in the rightmost indicated by a white arrow. Nuclei were counterstained with DAPI (blue). Scale bar = 12 μm. (H) The numbers of cells with cytoplasmic TDP-43 inclusions were quantified from each view of microscopic images (P < 0.0001; one-way ANOVA followed by post hoc Tukey test). Data are shown as box-and-whisker plots (min to max). The central horizontal line within the box indicates the median value. Statistically significant differences are denoted by asterisks (*P < 0.05, **P ≤ 0.01 and ***P ≤ 0.001).

