Figure 3.
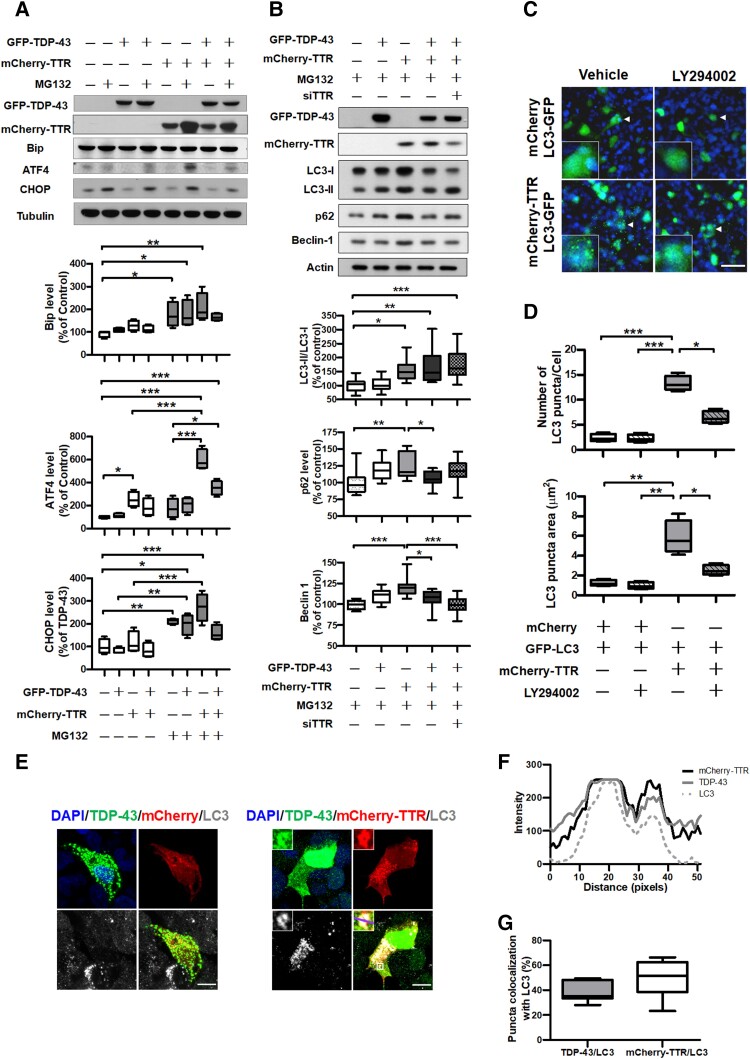
TTR induces autophagy activation that enhances autophagosome formation and spatial colocalization and promotes ATF4 upregulation to be independent of the UPR signalling. The cell lysates of TDP-43 proteinopathy mimicked in HEK293 cells with or without TTR expression were subjected to determine intracellular pathway activation. Western blot analyses of (A) the key factors related to the UPR signalling and (B) autophagy-associated markers responded to TTR. Densitometric quantification of each factor was normalized by Tubulin and Actin, respectively (UPR: Bip P = 0.0025, ATF4 P < 0.0001, CHOP P < 0.0001; Autophagy: LC3-II/I P < 0.0001, p62 P = 0.0028, Beclin-1 P < 0.0001). (C) Confocal images of LC3-GFP transfected HEK293 cells were co-expressed with mCherry or mCherry-TTR applied to evaluate LC3-GFP puncta formation with or without 10 μM LY294002 administration. The magnified view is shown in the lower left indicated with a white arrow. Nuclei were counterstained with DAPI (blue). Scale bar = 50 μm. (D) Quantification of LC3-GFP puncta number per cell and puncta area were used to assess the change of LC3-GFP puncta affected by mCherry-TTR expression. Administration of 10 μM LY294002 inhibited LC3-GFP puncta formation (Puncta number P < 0.0001, puncta area P < 0.0001). (E) Representative IF images of LC3 staining in TDP-43 proteinopathy mimetic cells with respective mCherry control and mCherry- =TTR expression. Nuclei were counterstained with DAPI (blue). Scale bar = 10 μm. The magnified view shown in the upper left is indicated with a white square line, and a purple transversal line shown on the magnified merge image was selected to present RGB plot in F. (F) The pixel intensities (y-axis) of mCherry-TTR (black line), TDP-43 (grey line) and LC3 (grey dashed line) display the distribution of fluorescence across the selected purple line in E, in which the consistent intensity change profiles of mCherry-TTR, TDP-43 and LC3 indicate their colocalization feature. (G) The percentages of TDP-43 and TTR puncta that, respectively, colocalize with LC3 were quantified. Data are shown as box-and-whisker plots (min to max). The central horizontal line within the box indicates the median value. Statistical analysis with one-way ANOVA followed by a post hoc Tukey test. Statistically significant differences are denoted by asterisks (*P < 0.05, **P ≤ 0.01 and ***P ≤ 0.001).

