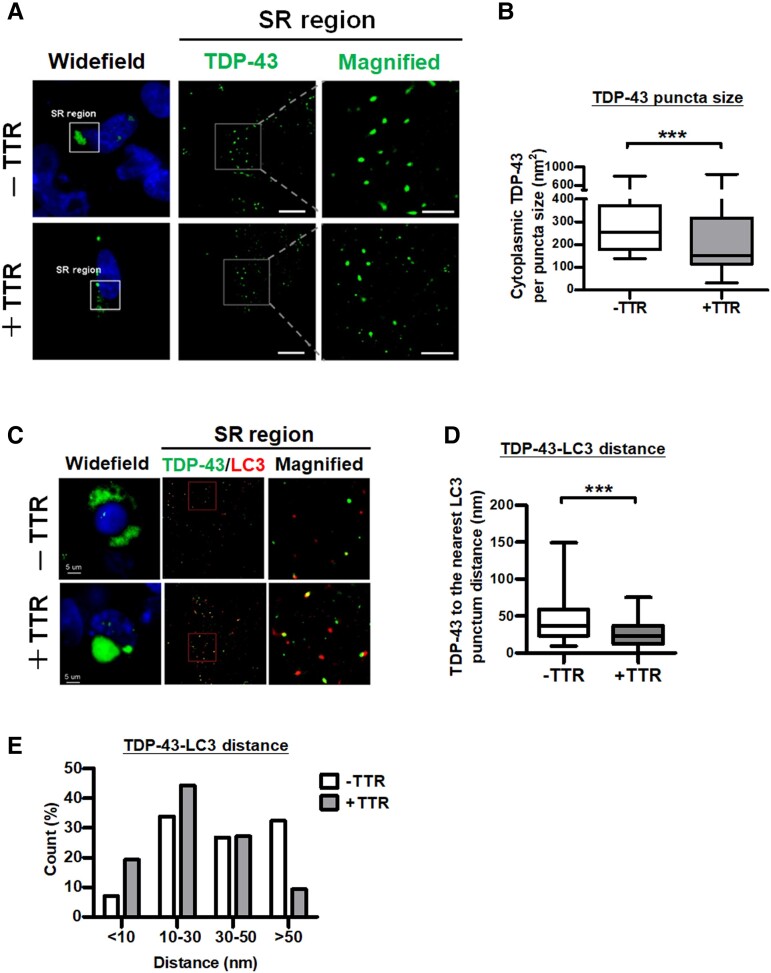
Figure 4.
TTR facilitates TDP-43 aggregates targeting autophagosomes for degradation. TDP-43 proteinopathy mimicked in HEK293 cells was co-expressed with mCherry control or mCherry-TTR for super-resolution dSTORM microscopy. (A) Left: Widefield fluorescence images selected higher-order TDP-43 assembly (green) region in the cytoplasm for further (middle) super-resolution imaging is denoted by a white square line. Right: A white square line with two extended dash lines indicates the magnification of assembled TDP-43 puncta from a super-resolution image. Nuclei were counterstained with DAPI (blue). Scale bar = 20 μm. (B) Quantifications of TDP-43 puncta size with or without TTR expression were resolved from dSTORM images (***P < 0.0001, t-test). (C) Left: The region acquired for super-resolution microscopy was selected from the widefield fluorescence image. Middle: Super-resolution imaging of the condition cells was immunostained with TDP-43 and LC3. Right: The magnified view displaying TDP-43 and LC3 distribution is indicated by the red square line. Scale bar = 5 μm. Quantifications of adjacent TDP-43 and LC3 puncta distributions resolved from dSTORM images are shown as (D) the mean distances (P < 0.0001, t-test) and (E) the distribution proportion of the distances. The distance proportions were calculated according to the number of TDP-43-LC3 puncta distances distributed in the indicated ranges of the grand total counts shown as a bar chart in E. The rest of the data are shown as box-and-whisker plots (min to max). The central horizontal line within the box indicates the median value. Statistically significant differences are denoted by asterisks (***P ≤ 0.001).

