Figure 6.
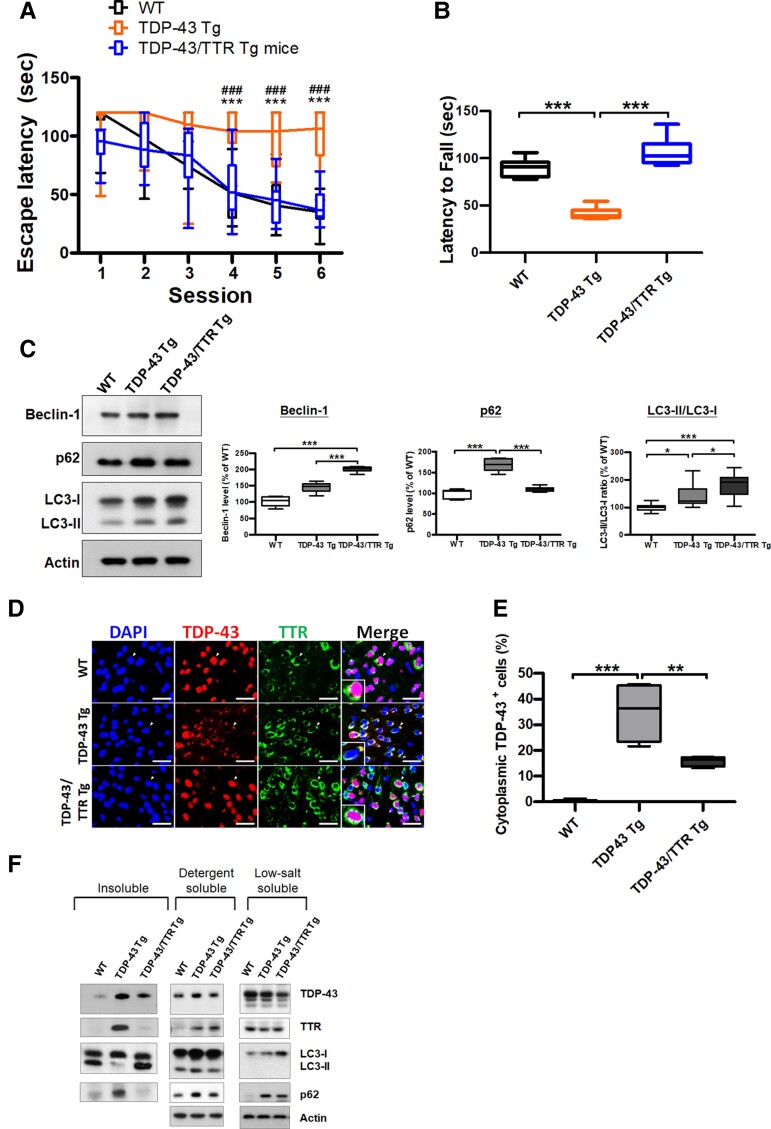
Neuron-specific expression of native TTR attenuates TDP-43 cytoplasmic accumulation via autophagy, ameliorating behaviour deficits caused by TDP-43 proteinopathy. (A) Morris water maze task was performed at 6 months in WT, TDP-43 Tg and TDP-43/TTR Tg mice. (P < 0.0001, repeated measures ANOVA, Bonferroni post hoc test) Neuronal TTR expression significantly improves cognitive function, shown by better escape latency in TDP-43/TTR Tg mice than TDP-43 Tg mice. (B) The rotarod test was performed to evaluate motor function of WT, TDP-43 Tg and TDP-43/TTR Tg mice at 6 months (P < 0.0001). Neuronal TTR expression alleviates motor defects shown longer latency to fall in TDP-43/TTR Tg mice compared to TDP-43 Tg mice. n = 10 mice per group. (C) Left panel: Western blot analysis of autophagy markers Beclin-1, p62/SQSTM1 and LC3 in the forebrain tissue lysates from WT, TDP-43 Tg and TDP-43/TTR Tg mice at 6 months. Right panels: The densitometries from western blot results were quantified and normalized by Actin (Beclin-1 P < 0.0001, p62 P < 0.0001, LC3 P < 0.0001, one-way ANOVA with Tukey test). (D) Double IF staining for TDP-43 (red) and TTR (green) in the forebrain tissue specimens of WT, TDP-43 Tg and TDP-43/TTR Tg mice. The magnified view presents the colocalization of TDP-43 and TTR in the cytoplasm shown in the lower left. Nuclei were counterstained with DAPI (blue). Scale bar = 50 μm. (E) Quantitative analysis of the cytoplasmic TDP-43 inclusions in the forebrain tissue among WT, TDP-43 Tg and TDP-43/TTR Tg mice (P < 0.0001, one-way ANOVA with Tukey test). Neuronal expression of TTR reduced the cytoplasmic accumulation of TDP-43 in TDP-43/TTR Tg mice compared to TDP-43 Tg mice. (F) Immunoblots were probed with TDP-43, TTR and autophagy markers, p62/SQSTM1 and LC3, in the insoluble (urea-soluble), detergent-soluble and LS soluble fractions from the brain tissue extractions of WT, TDP-43 Tg and TDP-43/TTR Tg mice. Escape latency data are shown as overlaying box-and-whisker plots (min to max) and line plots. The rest of the data are shown as box-and-whisker plots (min to max). The central horizontal line within the box indicates the median value. Statistically significant differences are denoted by asterisks (*P < 0.05, **P ≤ 0.01 and ***P ≤ 0.001). n = 10 sections per mouse; n = 5 mice per group.

