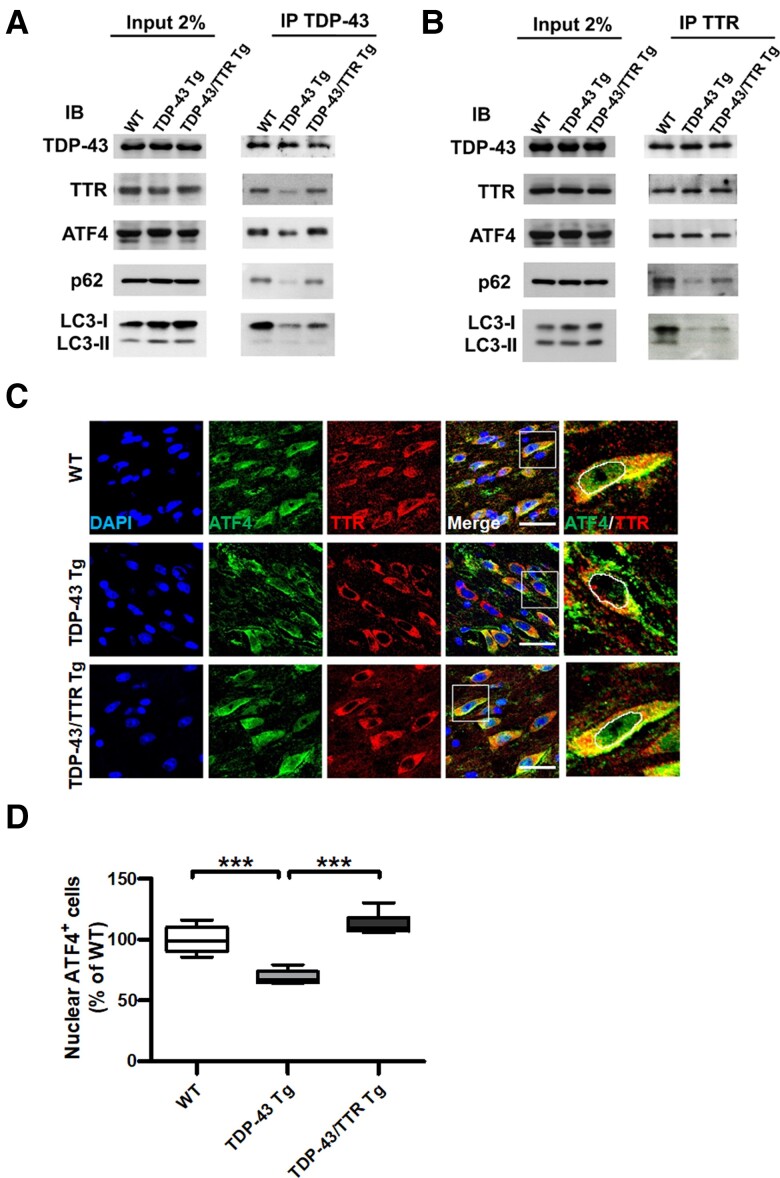
Figure 7.
TTR forms a complex with TDP-43 and ATF4 mediating two-way regulations for either targeting TDP-43 aggregates to autophagosomes or promoting nuclear translocation of ATF4. (A) Immunoprecipitation of TDP-43 or (B) TTR from the brain tissue lysates of WT, TDP-43 Tg and TDP-43/TTR Tg mice at 6 months followed by western blot analysis of the indicated interacting proteins. Representative western blots of proteins detected from (Left panel) crude tissue lysates and (Right panel) Co-IP elutes. IB, immunoblotting; IP, immunoprecipitation. (C) Confocal images of double IF staining ATF4 (green) and TTR (red) in the forebrain tissue specimens from 6 months old of WT, TDP-43 Tg and TDP-43/TTR Tg mice. The rightmost panel displays the magnified view of ATF4 and TTR merged image circling out the nuclear region, as indicated by a white square line in the previous image. The nuclei were counterstained with DAPI (Blue). Scale bar = 30 μm. (D) Quantification of the nuclear localization of ATF4 was processed by TissueQuest software in the TissueFAXS system (TissueGnostics GmbH) (P < 0.0001). The basal nuclear fluorescence intensity was set up based on ATF4 intensity in WT and gathered the number of cells with ATF4 intensity equal or above baseline intensity. Data are shown as box-and-whisker plots (min to max). The central horizontal line within the box indicates the median value. Statistical analysis with one-way ANOVA followed by post hoc Tukey test. Statistically significant differences are denoted by asterisks (***P ≤ 0.001). n = 8 sections per mouse; n = 6 mice per group.

