Figure 8.
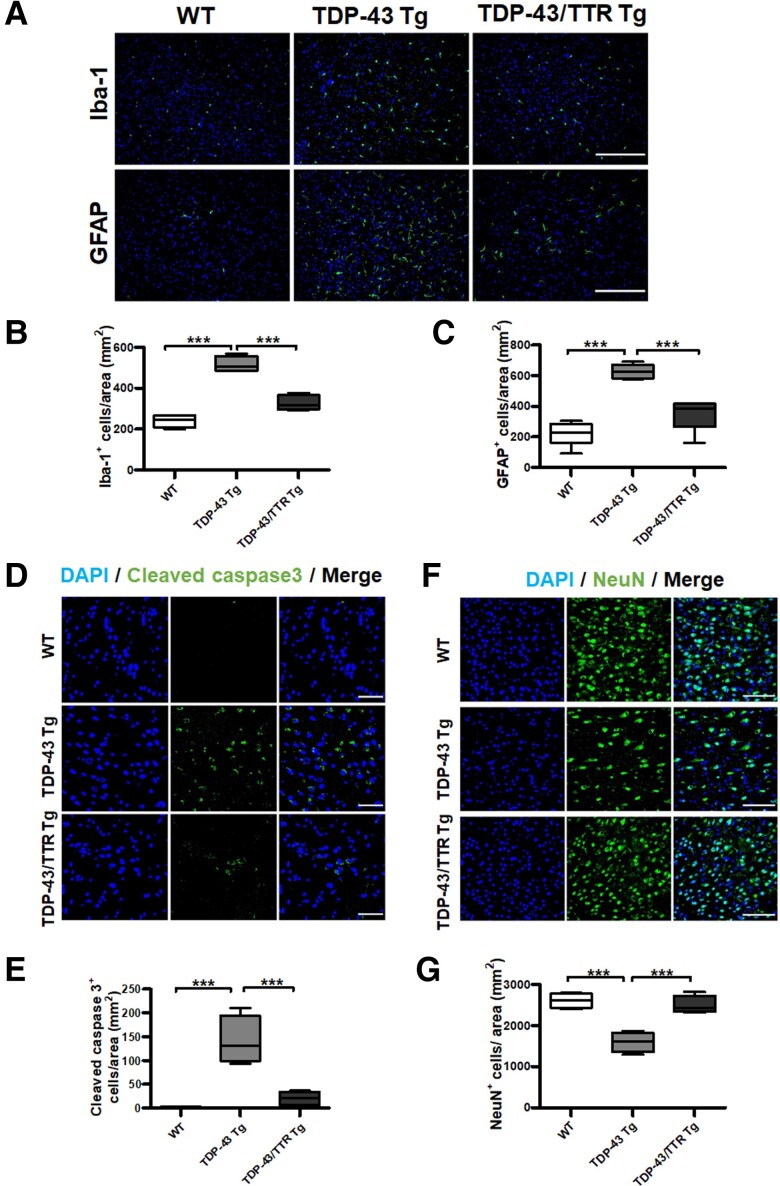
Neuronal expression of TTR alleviates TDP-43 proteinopathy-caused neuropathology, presenting reduced microgliosis and astrogliosis, diminished neuronal apoptosis and increased neuronal survival. (A) Representative images of (top) Iba-1 and (bottom) GFAP were immunostained in the forebrain tissue specimens of 1-year-old WT, TDP-43 Tg, TDP-43/TTR Tg mice. Nuclei were counterstained with DAPI (blue). Scale bar = 200 μm. The number of cells with (B) Iba-1- and (C) GFAP immunoreactivity were quantified by TissueQuest software. The numbers of microglial and astrocytic cells were significantly decreased upon neuronal TTR expression in TDP-43/TTR Tg mice compared to TDP-43 Tg mice (Iba-1 P = 0.0002, GFAP P < 0.0001). (D) Representative images from the brain tissue specimens from the age of 1-year-old WT, TDP-43 Tg, TDP-43/TTR Tg mice were immunostained with cleaved caspase 3. Scale bar = 50 μm. (E) The number of cleaved caspase 3-positive cells represented apoptotic death cells was quantified by TissueQuest software. Cellular death by apoptosis was substantially reduced on neuronal TTR expression in TDP-43/TTR Tg mice compared to TDP-43 Tg mice (P = 0.0002). (F) Representative images of the brain tissue specimens were immunostained with NeuN in WT, TDP-43 Tg and TDP-43/TTR Tg mice at the age of 1 year. Scale bar = 100 μm. (G) Quantification of NeuN-positive neurons evaluated neuronal survival using TissueQuest software (P = 0.0002). Nuclei were counterstained with DAPI (blue). Data are shown as box-and-whisker plots (min to max). The central horizontal line within the box indicates the median value. Statistical analysis with one-way ANOVA followed by post hoc Tukey test. Statistically significant differences are denoted by asterisks (***P < 0.001). n = 8 sections per mouse; n = 6 mice per group.

