Figure 3.
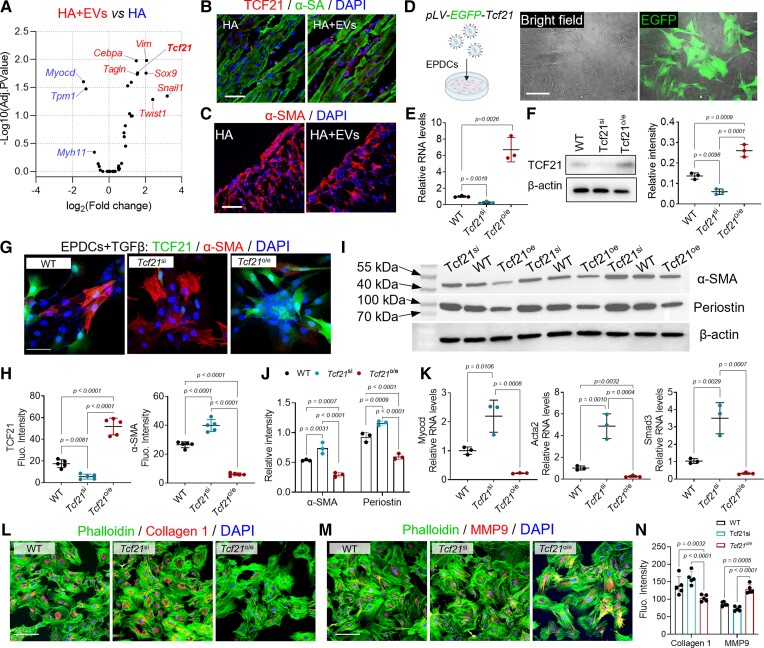
Extracellular vesicle treatment up-regulates Tcf21 to inhibit profibrotic TGF-β signalling. (A) RNA-seq analysis of epicardial cell differentiation–related gene expression. (B–C) Immunofluorescence staining of Tcf21 and α-SMA in the infarct. Scale bar, 60 μm. (D) Establishment of Tcf21 overexpressing (Tcf21oe) epicardium-derived cells’ cell line through lentivirus transfection. The transfection was confirmed by detecting green fluorescent protein expression. Scale bar, 60 μm. (E) Relative gene expression of Tcf21 in established cell lines. Data were acquired from triplicated tests and expressed as mean ± SD. (F) Western blot detection of Tcf21 expression in established epicardium-derived cells’ cell lines. (G) Immunofluorescence staining of Tcf21 and α-SMA in epicardium-derived cells after TGF-β incubation, and accordingly the fluorescent intensity (Fluo. Intensity) was measured for quantitative analysis (H). Data are expressed as mean ± SD. Quantitative data were acquired from five images in each group. Scale bar, 60 μm. (I) Western-blot detection of α-SMA and periostin expression and (J) the quantitative data. (K) Quantitative reverse transcription–polymerase chain reaction detection of Myocd, Acta2, and Smad3 expression in epicardium-derived cells. Data were acquired from triplicated tests and expressed as mean ± SD. (L–N) Immunostaining detection of Collagen 1 and MMP9 expression in epicardium-derived cells and the quantitative data (N). Quantitative data were acquired from five images in each group and expressed as mean ± SD. Scale bar, 60 μm.

