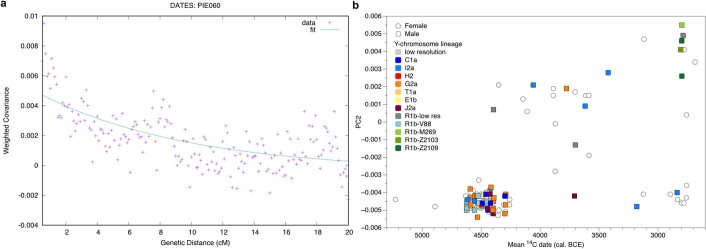
Extended Data Fig. 3. DATES and Y-chromosomal haplogroup diversity.
a, DATES decay curve for the CA outlier individual PIE060 with SEE N and Iron Gates HGs as source populations. b, Changes of Y-chromosomal haplogroup diversity (colour fills) over time (mean 14C dates cal. BC; x-axis) with respect to changes in autosomal ancestry as reflected in PC2 (y-axis), based on the relative density of female (open circles) and male (colour filled squares) of all newly reported individuals in this study.

