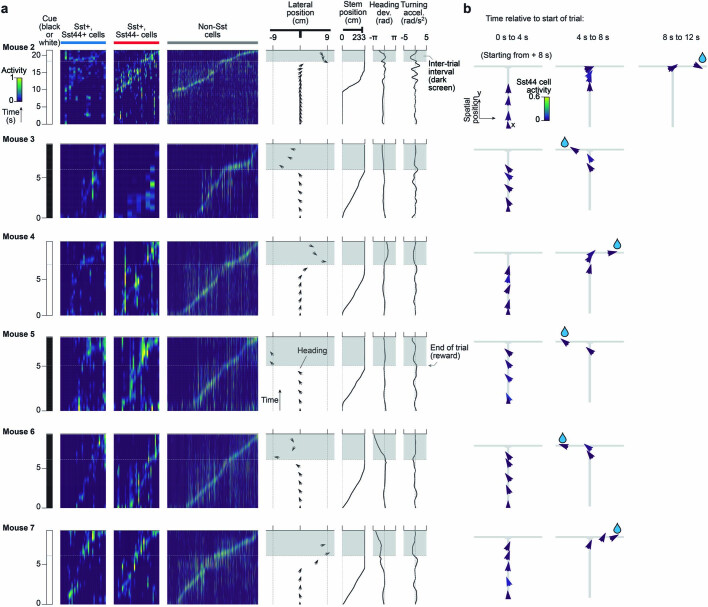
Extended Data Fig. 4. Smooth navigation behaviour during example trials with low Sst44 cell activity for each mouse.
a, Activity and behaviour over time during trials with low Sst44 cell activity. Same examples as in Supplementary Video 1 (mouse 1 shown in Fig. 5b). Each column in the activity heatmaps represents the activity of one cell over time. Cells sorted based on peak activity along the maze. Smoothed activity is plotted. Black arrows indicate the lateral position and heading of the mouse over time (pointing up is toward the end of the maze). b, Activity as a function of the mouse’s trajectory. X and y length scales are not proportional.

