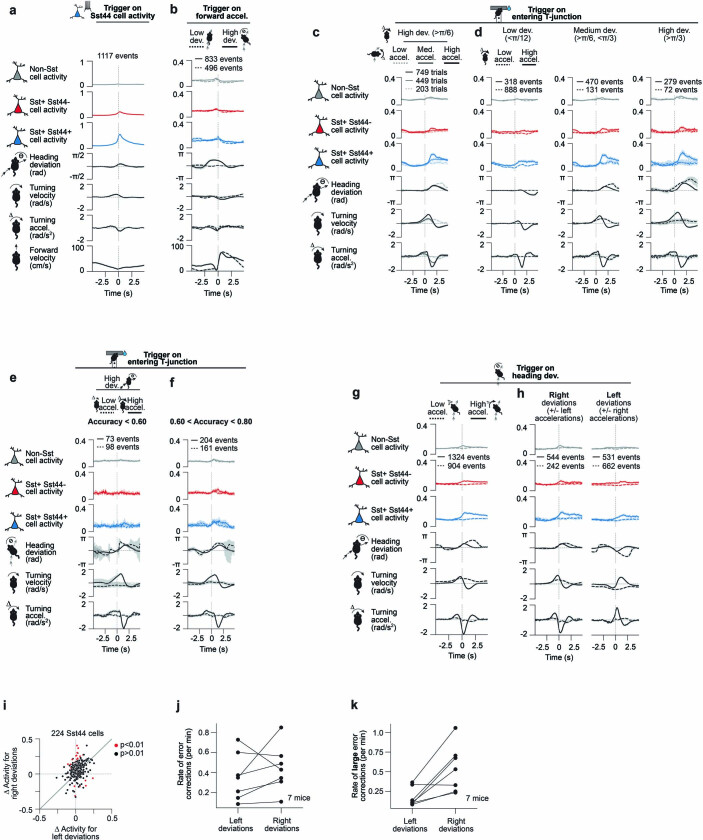
Extended Data Fig. 7. Characterization of activity during forward movements, errors and corrections of varying magnitudes, error corrections during training, and corrections in different directions.
a–b, Slow down and speed up in forward velocity before and after Sst44 cell activity, but weak contribution of forward velocity to Sst44 cell activity. 7 mice, 27 sessions. a, Activity and behaviour, including forward velocity, averaged over large bursts of Sst44 cell activity (smoothed Sst44 cell activity > 0.4). b, Activity and behaviour during sharp increases in forward running (forward accel. > 70 cm/s2), split by high (> π/6) and low (< π/12) heading deviations. Left and right deviations were pooled after inverting behaviour for left deviations. c–d, Sst44 cell activity as a function of turning acceleration and heading deviation magnitude. 7 mice, 27 sessions. c, Activity and behaviour as the mouse entered the T-junction with a large (>π/6) heading deviation, split based on whether the mouse corrected with a low (< 0.5 rad/s2), medium (>0.5, <1 rad/s2), or high (>1, <2 rad/s2) turning acceleration in the opposite direction. Left and right deviations were pooled after inverting behaviour for left deviations. Wilcoxon rank-sum test across trials, Sst44 cell activity high vs medium accel.: p = 6e-11, medium vs low accel.: p = 6e-5. d, Activity and behaviour as the mouse entered the T-junction with a small (<π/12), medium (>π/6, <π/3) or large (>π/3) heading deviation, split based on whether the mouse corrected with a high (>1, <2 rad/s2) or low (<0.5 rad/s2) turning acceleration in the opposite direction. High turning accelerations were capped at 2 rad/s2 to better compare across conditions. Left and right turning accelerations were pooled after inverting behaviour for right accelerations. Wilcoxon rank-sum test across trials, Sst44 cell activity solid line, low vs medium or high deviation: p < 1e-8, medium vs high deviation: p = 0.64. Activity averaged over 0.5 to 2.5 s relative to −1 to 0 s was used for statistical analyses for c–d. e–f, Sst44 cell activity during training. e, Activity during training for sessions with low accuracy (< 0.6). At this stage of training, a landmark indicates the location of the reward. Activity and behaviour as the mouse entered the T-junction with a large (>π/6) heading deviation, split based on whether the mouse corrected with a low (< 0.5 rad/s2), or high (>1 rad/s2) turning acceleration in the opposite direction. Left and right deviations were pooled after inverting behaviour for left deviations. 3 mice, 4 sessions. f, Same as e, for sessions with intermediate accuracy (> 0.6, < 0.8). 5 mice, 7 sessions. Wilcoxon rank-sum test across trials, Sst44 cell activity solid vs dashed line: p = 0.5 (e), p = 7e-3 (f), solid line f vs e: p = 0.02. Activity averaged over 0.5 to 2.5 s relative to −1 to 0 s was used for statistical analyses for e–f. g–k, Sst44 cell activity is present during leftward and rightward course corrections, even though course corrections occurred more often in response to right deviations. 7 mice, 27 sessions. g, Activity and behaviour during heading deviations (> π/6) at any point in the maze, split by whether the mouse corrected with a strong (> 1 rad/s2) or a weak (< 0.5 rad/s2) opposing turning acceleration delayed by +0.3 s (Methods). Left and right deviations were pooled after inverting behaviour for left deviations. h, Same as g, showing left and right deviations separately. In this analysis we additionally capped the heading deviation at π/3 and the turning acceleration at 2 rad/s2 to better compare activity between left and right deviations. i, Mean change in activity (0 to 3 s versus −2 to −1 s in h) in single Sst44 cells in response to corrections for left and right deviations. We selected errors and corrections within the same range as in h, to better compare activity between left and right corrections. We note that this analysis has more noise because (1) we are measuring from single cells, and (2) we restricted the analysis to one session (to sample independent cells), which will have a limited number of deviations to analyse. Cells that are significantly more active for either left or right deviations are highlighted in red (p < 0.01, Wilcoxon rank-sum test across turning events, corrected using Benjamini-Hochberg method). j, Rate of course corrections for left and right deviations. Course corrections defined as in g. k, Rate of large course corrections (heading deviation > π/3, turning accel. > 1 rad/s2 in the opposite direction), showing a strong bias toward large course corrections for right deviations, mirroring the slight bias in activity in h. Mean and bootstrapped 95% confidence intervals are shown.

