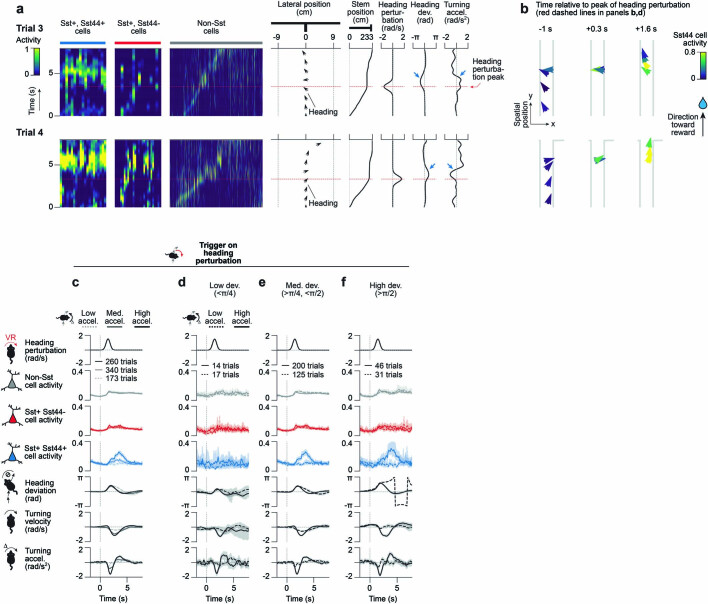
Extended Data Fig. 8. Examples and quantitative characterization of Sst44 cell activity during heading perturbations.
a–b, Additional examples of Sst44 cell activity during corrections for experimentally induced heading deviations. a, Activity (smoothed) and behaviour over time during heading perturbations. Same examples as in Supplementary Video 4. Each column in the activity heatmaps represents the activity of one cell over time. Cells sorted based on activity along the maze. Black arrows indicate the lateral position and heading of the mouse over time (pointing up is toward the end of the maze). Trial clipped to highlight heading perturbation event. b, Activity as a function of the mouse’s trajectory relative to the heading perturbation (t = 0). X and y length scales are not proportional. c–f, Sst44 cell activity as a function of turning acceleration and heading deviation magnitude during heading perturbations. 8 mice, 16 sessions. c, Mean activity and behaviour during heading perturbations, split by whether the mouse corrected strongly (turning accel. > 1 rad/s2 in the opposite direction, +2 s after the heading perturbation was triggered – trigger indicated by the grey dashed line at 0 s), moderately (turning accel. > 0.5 rad/s2, < 1 rad/s2) or weakly (< 0.5 rad/s2). Left and right heading perturbations were pooled after inverting behaviour for leftward perturbations. Wilcoxon rank-sum test across trials, Sst44 cell activity strong vs moderate accel.: p = 4e-7, moderate vs weak accel.: p = 1e-3. d–f, Mean activity and behaviour during heading perturbations, splitting by low (d, <π/4), moderate (e, >π/4, <π/2) and high (f, >π/2) heading deviations, as well as strong (>1 rad/s2) and weak (<0.5 rad/s2) turning accelerations in the opposite direction. Wilcoxon rank-sum test across trials, Sst44 cell activity high vs moderate or low heading deviation: p < 0.01, moderate vs low: p = 0.06. Activity averaged over 2.5 to 4.5 s relative to 0 to 1 s was used for statistical tests. Turning velocities and accelerations refer to ball movements, not virtual movements that also include the heading perturbation. Mean and bootstrapped 95% confidence intervals are shown.

